Skip to content
MathsGenie logo
Sign up

Home

Revision planner

Ask Genie AI

Worksheets

Versus

New

Daily Greens

Ideas + feedback

Scheme of learning

Calculation ProblemsFractions, Decimals and PercentagesUsing a CalculatorSubstitutionSolving One Step EquationsArea and PerimeterAnglesAveragesBar ChartsStem and Leaf

Tests

Test ATest BTest CTest D
  1. GCSE
  2. Maths OCR
  3. Scheme of learning

Stage 3 Test B

Question 1

Write 23% as a fraction.

[1]
Question 2

Write 0.79 as a percentage.

[1]
Question 3

Solve 7g=427g = 427g=42

[1]
Question 4

Ava wants to buy as many chocolate bars as she can.

She has £5 to spend on chocolate bars.

Each chocolate bar costs £0.42

Work out how much change Ava will get from £5.

[3]
Question 5

Use your calculator to work out 15.6−4.323.782\displaystyle \frac{\sqrt{15.6 - 4.32}}{3.78^2}3.78215.6−4.32​​

a.

Write down all the figures on your calculator display.

[2]
b.

Write your answer to part (a) correct to 2 decimal places.

[1]
Question 6

v=u+atv = u + atv=u+at

u=3 u = 3 u=3 a=10 a = 10 a=10 t=6 t = 6 t=6

Work out the value of vvv.

[2]
Question 7

The diagram shows a garden is in the shape of a trapezium.
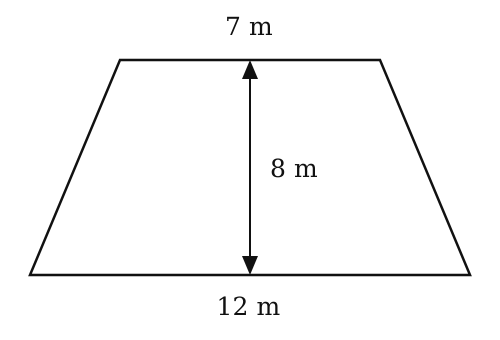
Diagram of a trapezium representing a garden. The top horizontal side is labeled 7 m. The bottom horizontal side is labeled 12 m. A vertical line segment with arrows at both ends connects the two horizontal sides and is labeled 8 m, representing the height.

Find the area of the garden.

[3]
Question 8

Solve 25−m=1125 - m = 1125−m=11

[1]
Question 9

Here are the weights, in grams, of 6 potatoes

137 123 107 125 151 146

a.

Work out the range.

[1]
b.

Work out the median weight.

[2]
Question 10

Here are the times, in seconds, it took 20 people to run a race.

62 79 69 61 86 73 82 52 59 82 64 74 55 71 63 80 76 66 53 63

Draw an ordered stem and leaf diagram to show this information.
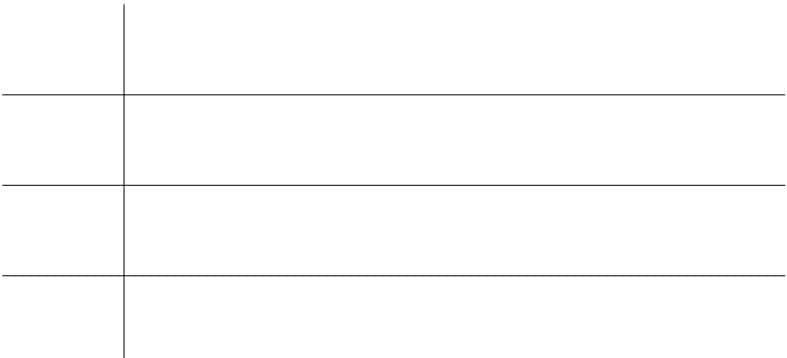
A blank stem and leaf diagram template. It consists of a vertical line (the stem) and three horizontal lines (the leaves) intersecting at three points, creating four rows for data entry.

Key:

[3]
Question 11

Here is a bar chart showing the scores of five students in their Maths and Science tests.
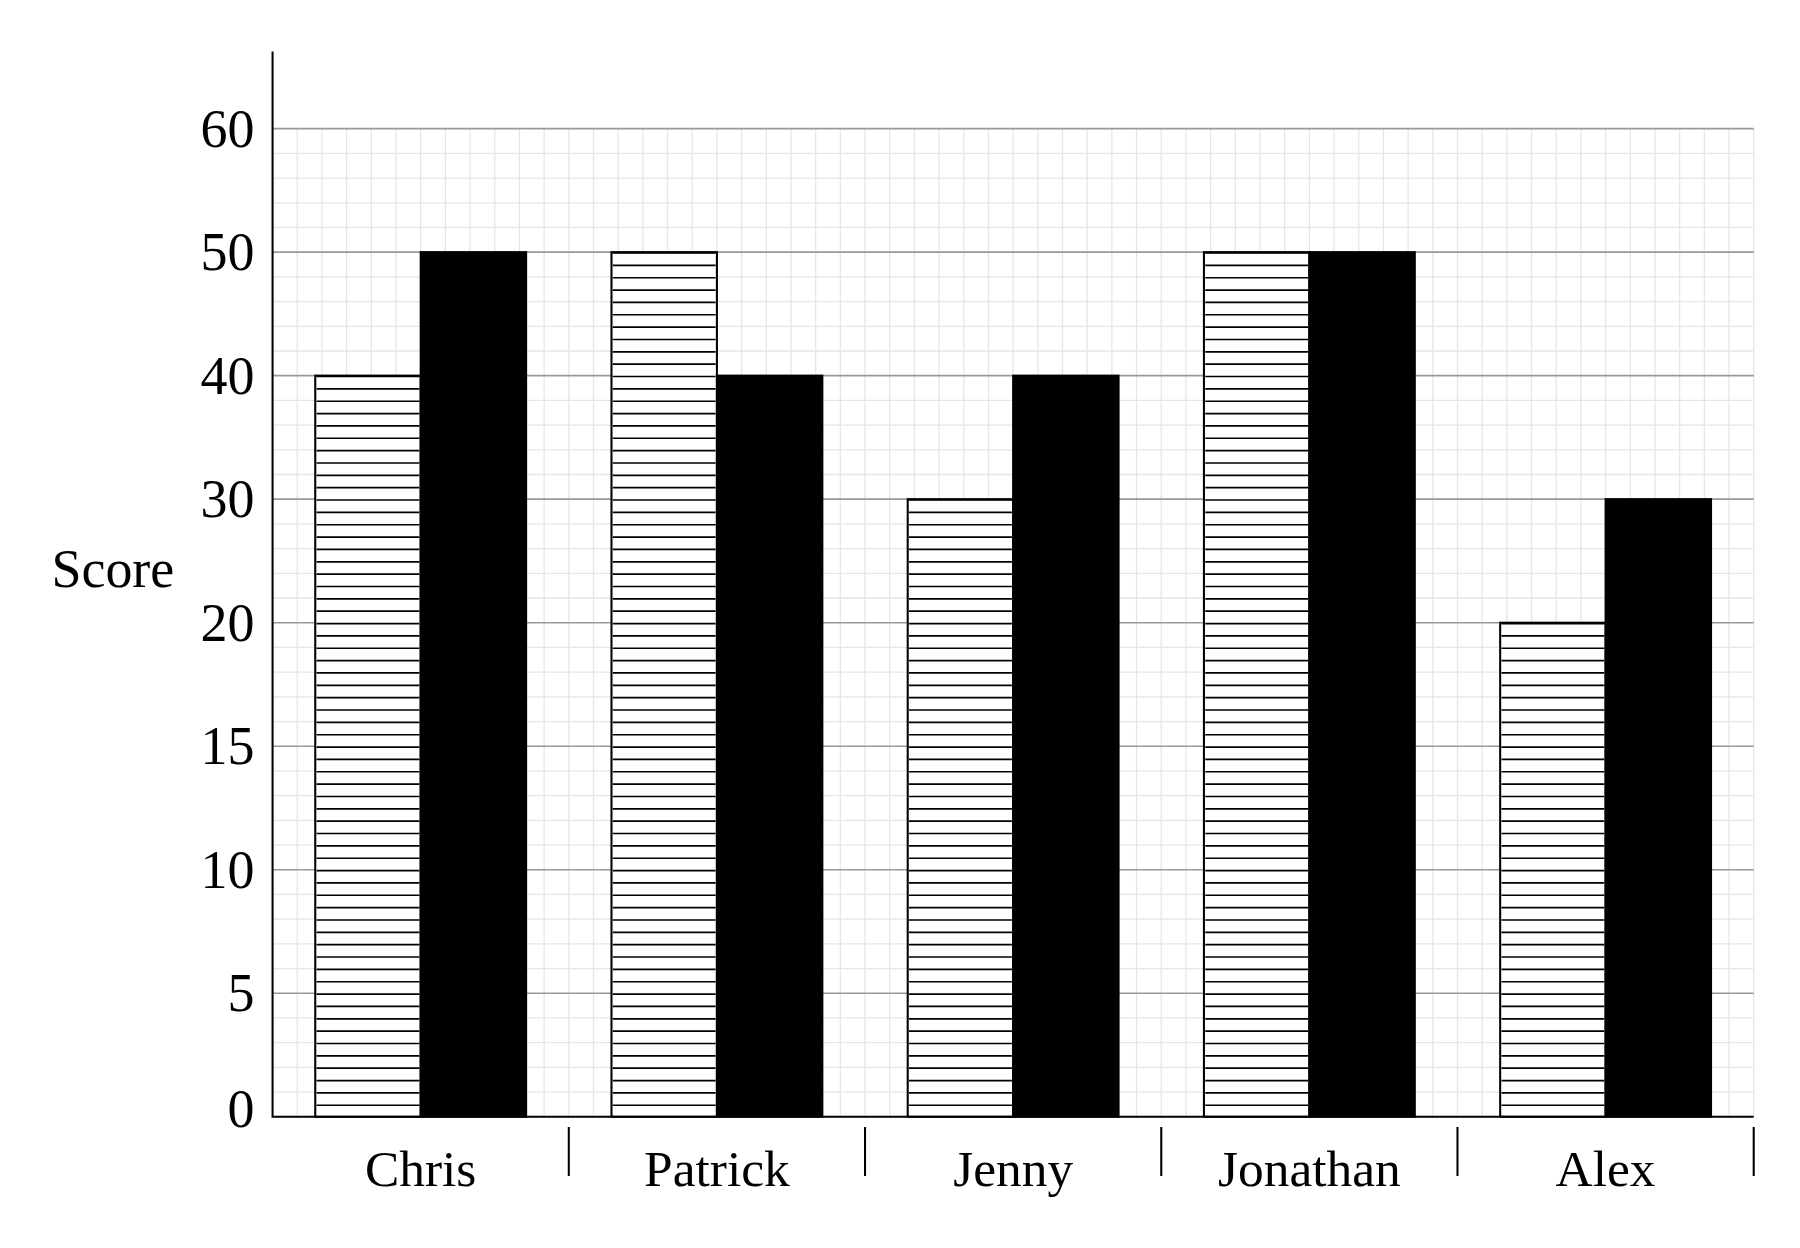
A bar chart shows paired striped and black bars for five students’ Maths and Science test scores.

Write down two things wrong with this graph.

[2]
Question 12

ABC ABC\,ABC is an isosceles triangle Work out the size of the angle marked xxx.
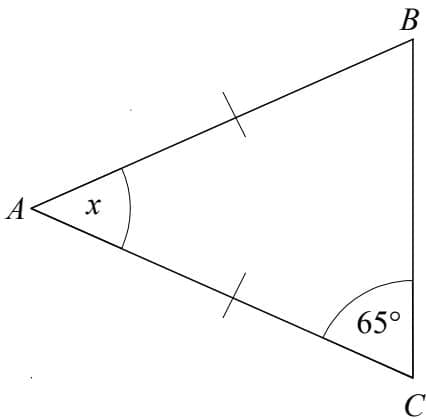
Diagram of an isosceles triangle ABC with angle A marked x and angle C marked 65 degrees.

Work out the size of the angle marked xxx.

[2]
