Question 22
Here is a sketch of the curve y=sinx∘y = \sin x^\circy=sinx∘ for 0≤x≤3600 \leq x \leq 3600≤x≤360
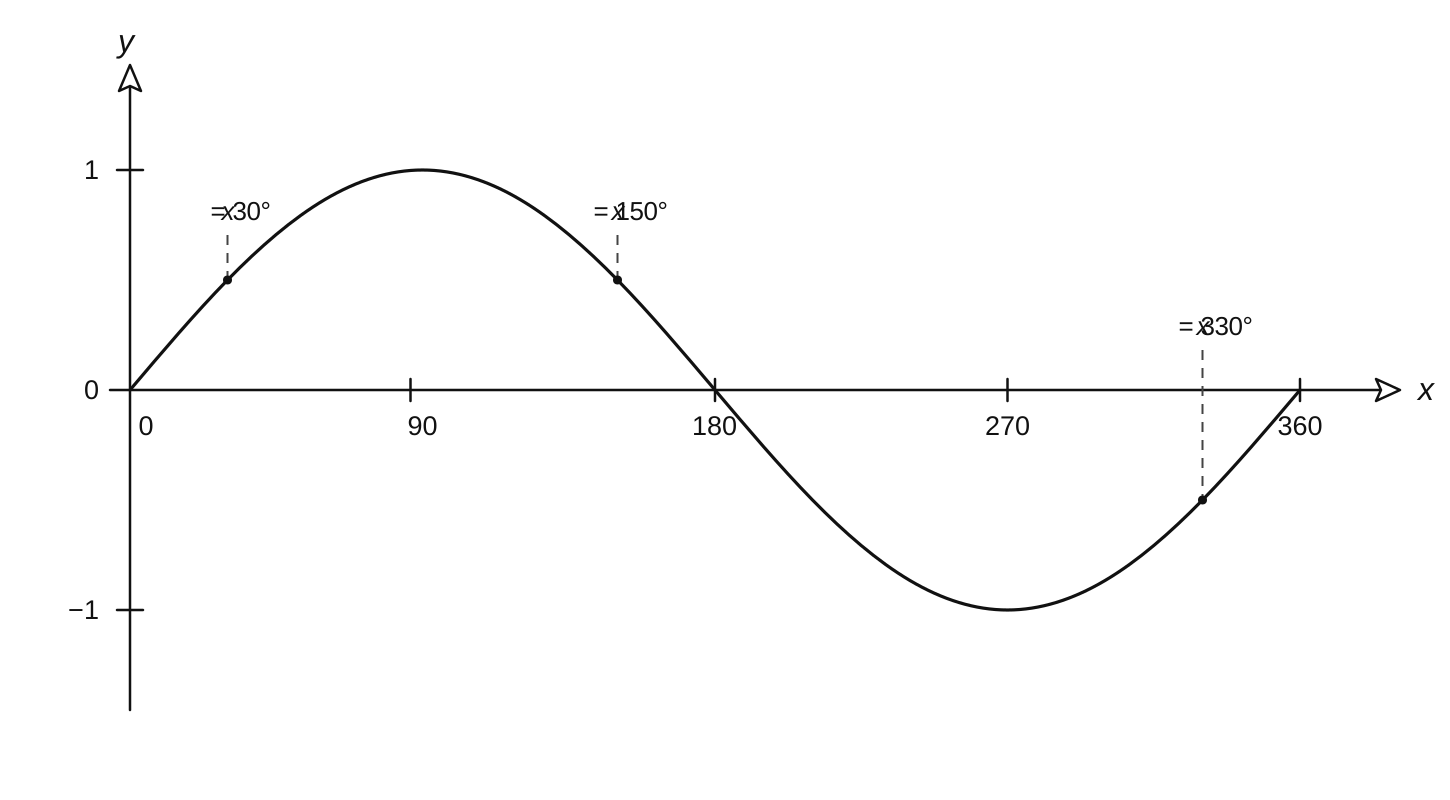
Given that sin30∘=12\displaystyle \sin 30^\circ = \frac{1}{2}sin30∘=21 write down the value of:
i.[1]
sin150∘\sin 150^\circsin150∘
ii.[1]
sin330∘\sin 330^\circsin330∘
Trigonometric and Exponential Graphs Questions
30 exam-style questions on OCR GCSE Maths Trigonometric and Exponential Graphs. Each one has a worked solution and a mark scheme showing where the marks go.