Question 4
The histogram shows information about the speed of cars passing a checkpoint.
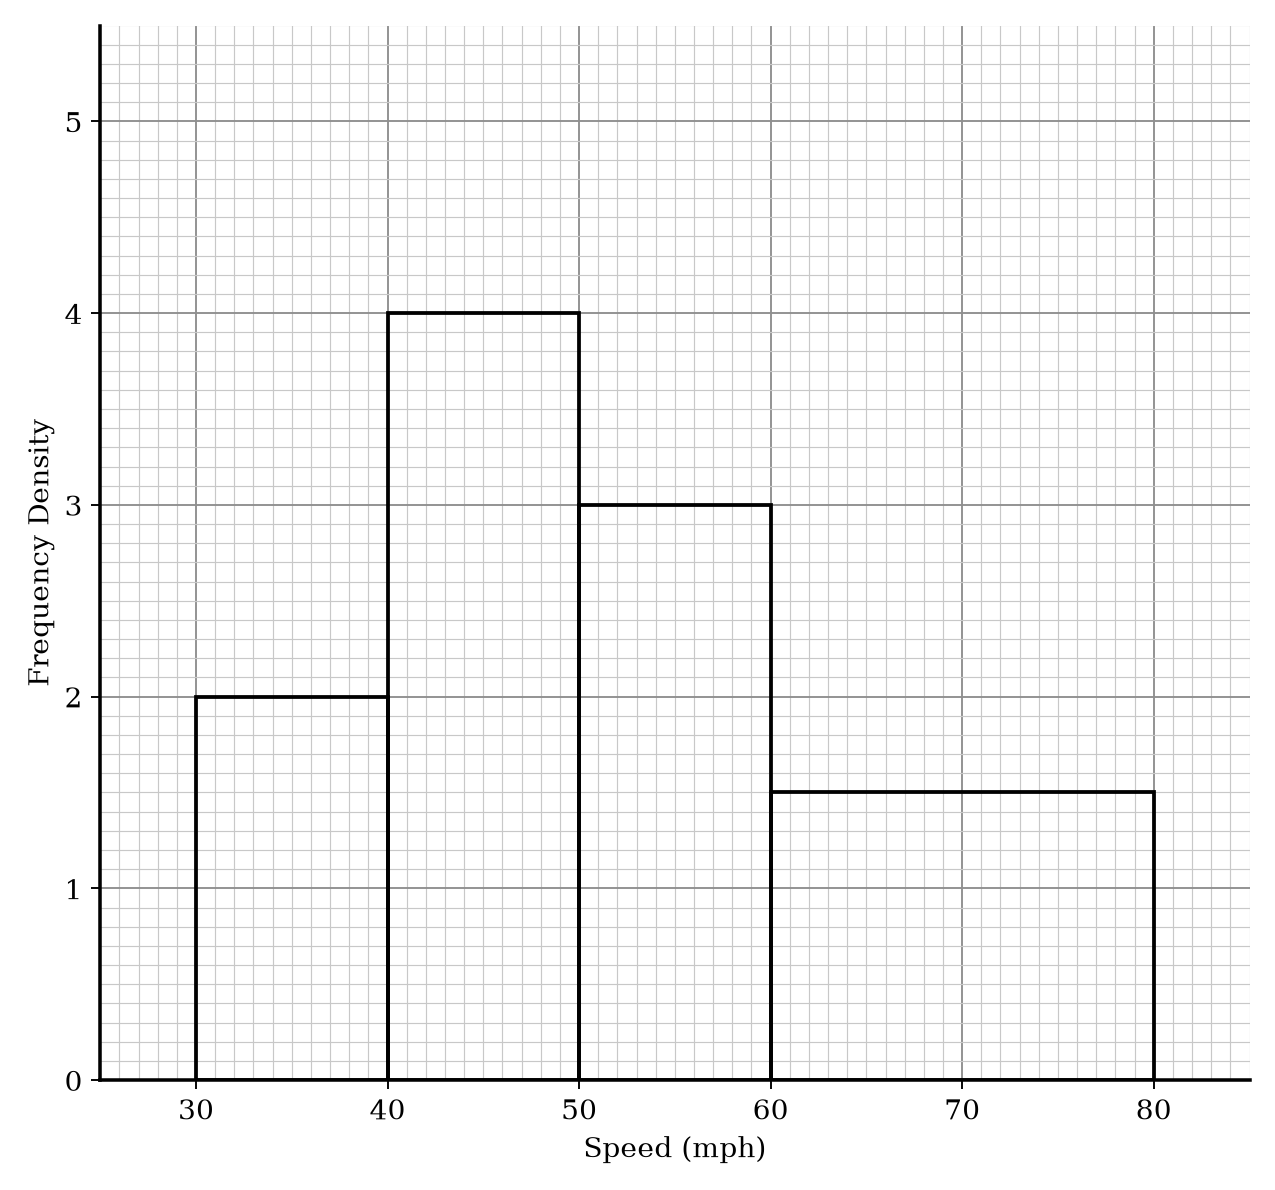
40 cars have a speed between 40 and 50 mph.
a.[3]
Work out an estimate for the number of cars which have a speed of more than 65 mph.
b.[1]
Explain why your answer to part a is only an estimate.
Histograms Questions
23 exam-style questions on OCR GCSE Maths Histograms. Each one has a worked solution and a mark scheme showing where the marks go.