Question 2
The cumulative frequency graph shows the height, in cm, of 100 seedlings.
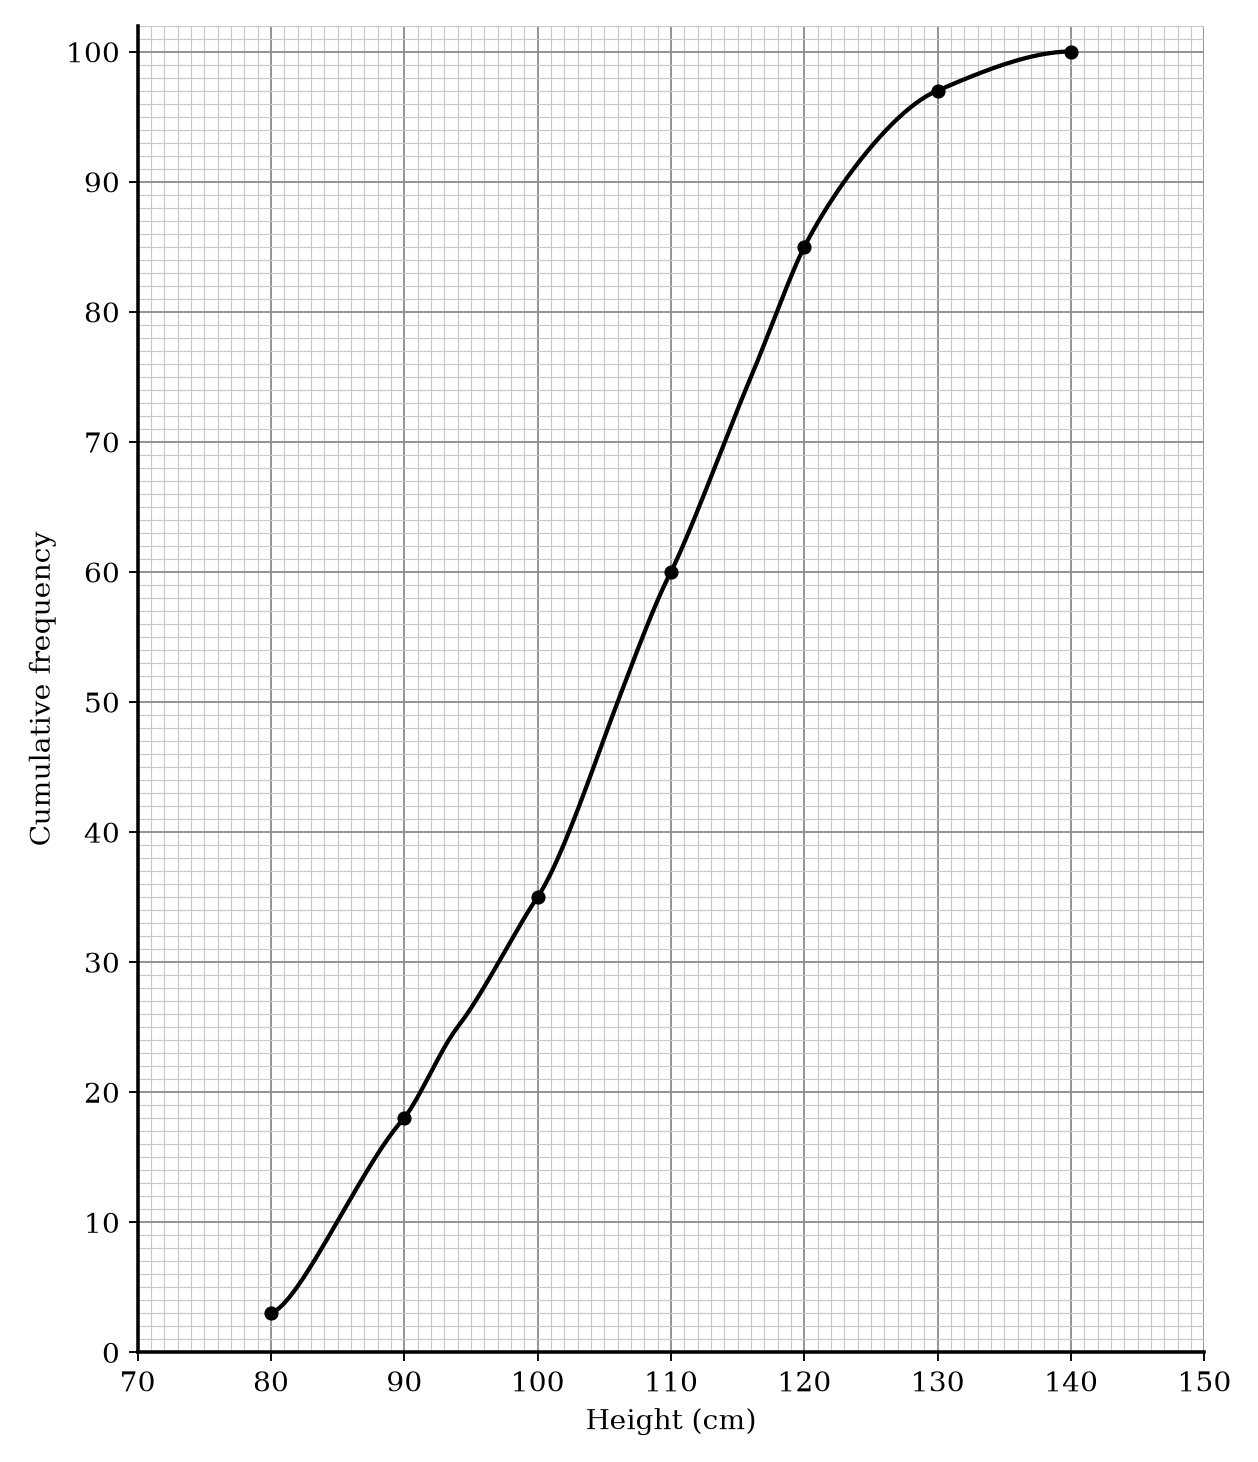
| Height (cm) | Cumulative frequency |
|---|---|
| 80 | 3 |
| 90 | 18 |
| 100 | 35 |
| 110 | 60 |
| 120 | 85 |
| 130 | 97 |
| 140 | 100 |
The 100 seedlings had a minimum height of 82 cm and a maximum height of 138 cm.
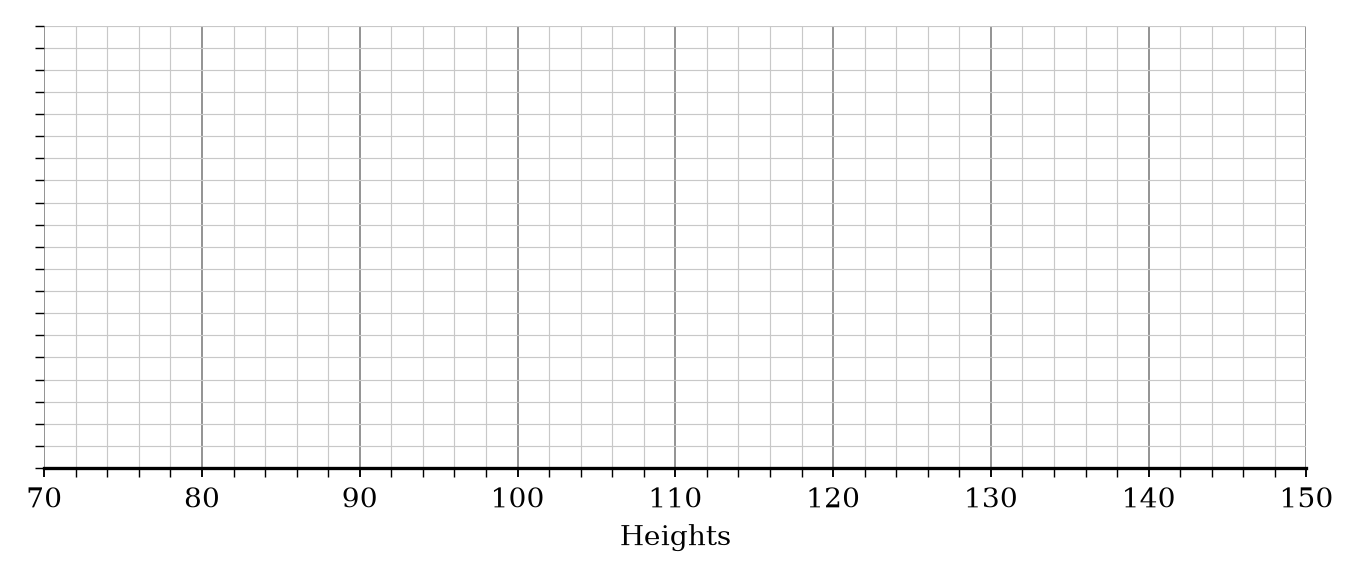
Draw a box plot to show the distribution of the heights of the seedlings.
Box Plots Questions
27 exam-style questions on OCR GCSE Maths Box Plots. Each one has a worked solution and a mark scheme showing where the marks go.