Question 2
Here is a bar chart showing the number of miles Paula and Rose ran from Monday to Friday in a week.
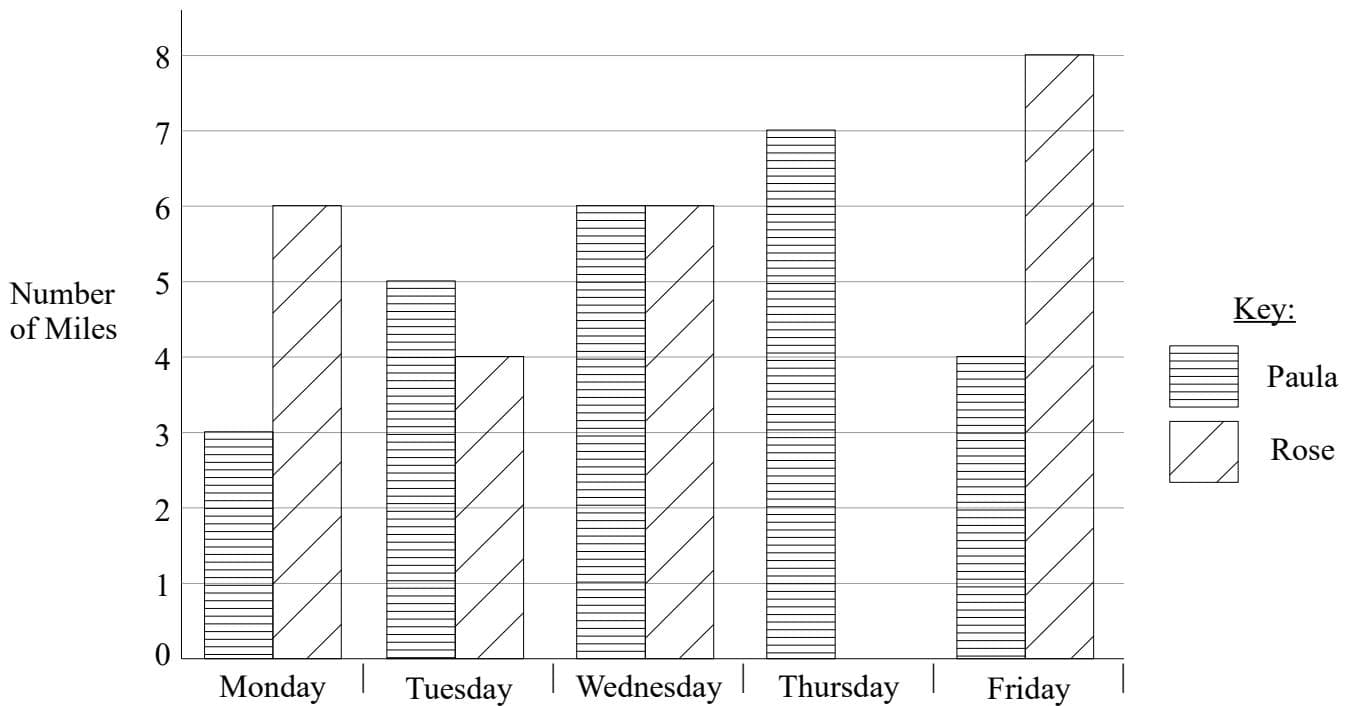
| Day | Paula (miles) | Rose (miles) |
|---|---|---|
| Monday | 3 | 6 |
| Tuesday | 5 | 4 |
| Wednesday | 6 | 6 |
| Thursday | 7 | (no bar drawn) |
| Friday | 4 | 8 |
a.[1]
Rose runs further than Paula on Monday. How much further?
b.[1]
Rose ran 6 miles on Thursday. Use this information to complete the bar chart.
c.[2]
Rose is not going to run on Saturday. How many miles would Paula have to run on Saturday so that the number of miles she runs from Monday and Saturday is the same as the number of miles Rose runs from Monday to Saturday.
Bar Charts Questions
21 exam-style questions on OCR GCSE Maths Bar Charts. Each one has a worked solution and a mark scheme showing where the marks go.