Question 6
Lydia records the favorite pet of 20 children in a playgroup. Here is the list of pets.
| Dog | Dog | Cat | Dog | Bird |
| Cat | Bird | Fish | Dog | Fish |
| Cat | Fish | Cat | Fish | Cat |
| Cat | Cat | Fish | Dog | Dog |
a.
[2]
Complete the table to show this information.
| Pet | Tally | Frequency |
|---|---|---|
| Cat | ||
| Dog | ||
| Bird | ||
| Fish |
b.[3]
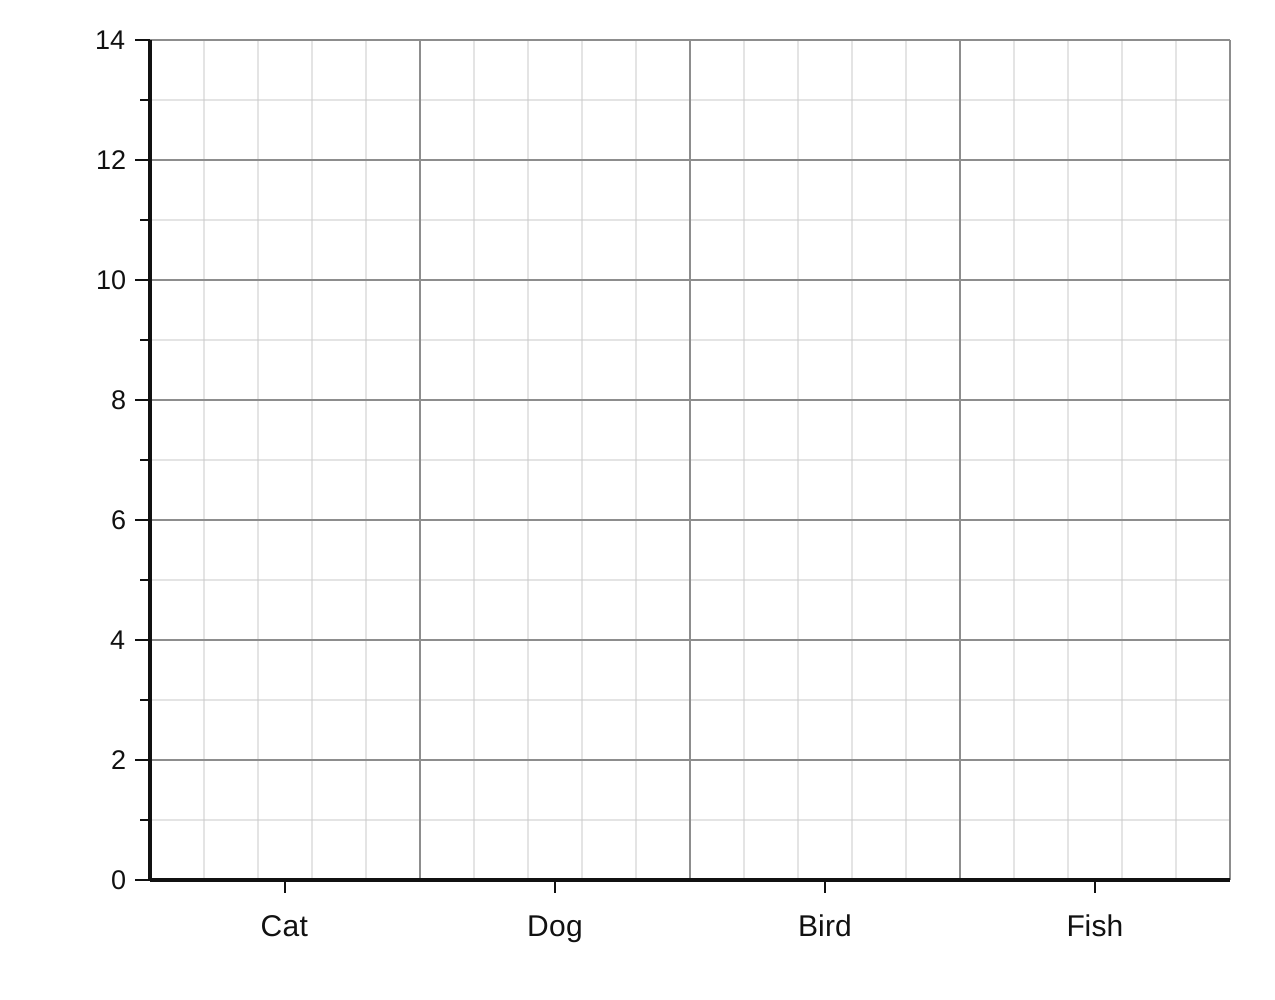
Draw a bar chart for this information.
Bar Charts Questions
21 exam-style questions on OCR GCSE Maths Bar Charts. Each one has a worked solution and a mark scheme showing where the marks go.