Question 4
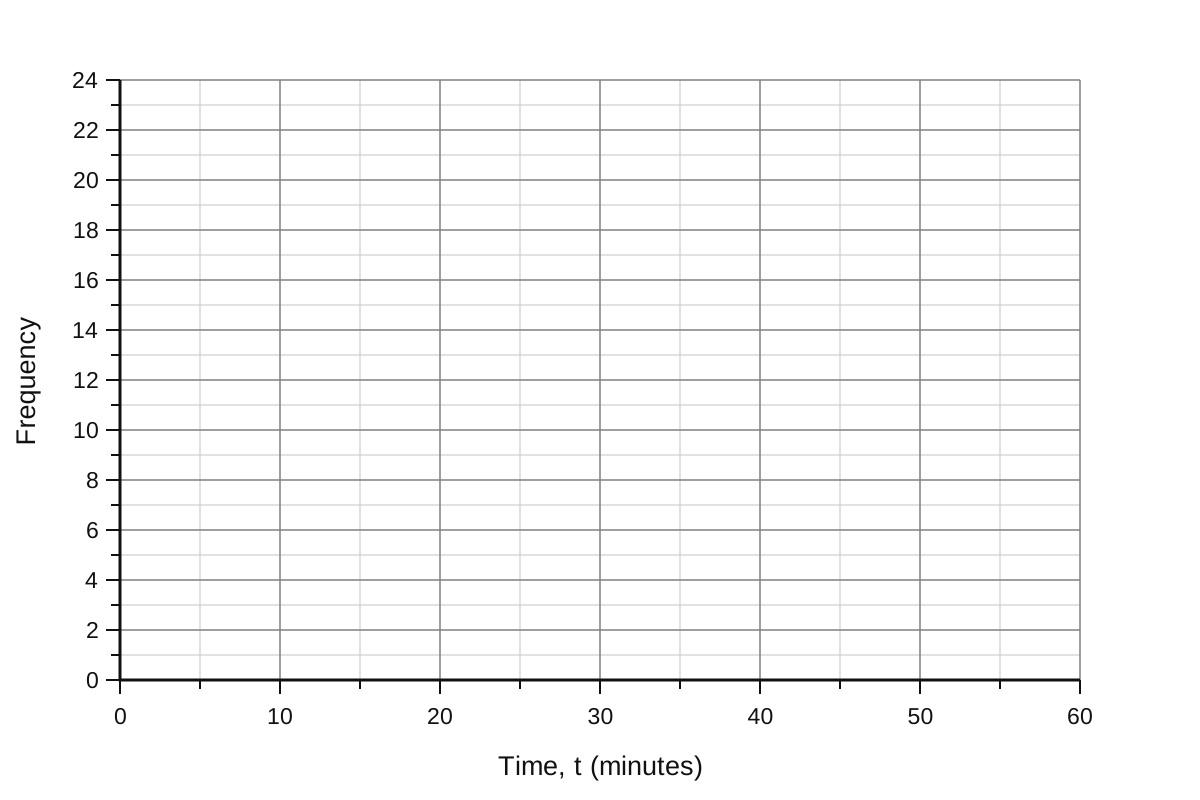
77%The frequency table shows the time, in minutes, taken by some students to complete a puzzle.
| Time (t t\,t minutes) | Frequency |
|---|---|
| 0<t≤100 < t \leq 100<t≤10 | 5 |
| 10<t≤2010 < t \leq 2010<t≤20 | 14 |
| 20<t≤3020 < t \leq 3020<t≤30 | 22 |
| 30<t≤4030 < t \leq 4030<t≤40 | 18 |
| 40<t≤5040 < t \leq 5040<t≤50 | 11 |
| 50<t≤6050 < t \leq 6050<t≤60 | 6 |
Draw a frequency polygon to show this information.
Frequency Polygons Questions
27 exam-style questions on OCR GCSE Maths Frequency Polygons. Each one has a worked solution and a mark scheme showing where the marks go.