Question 3
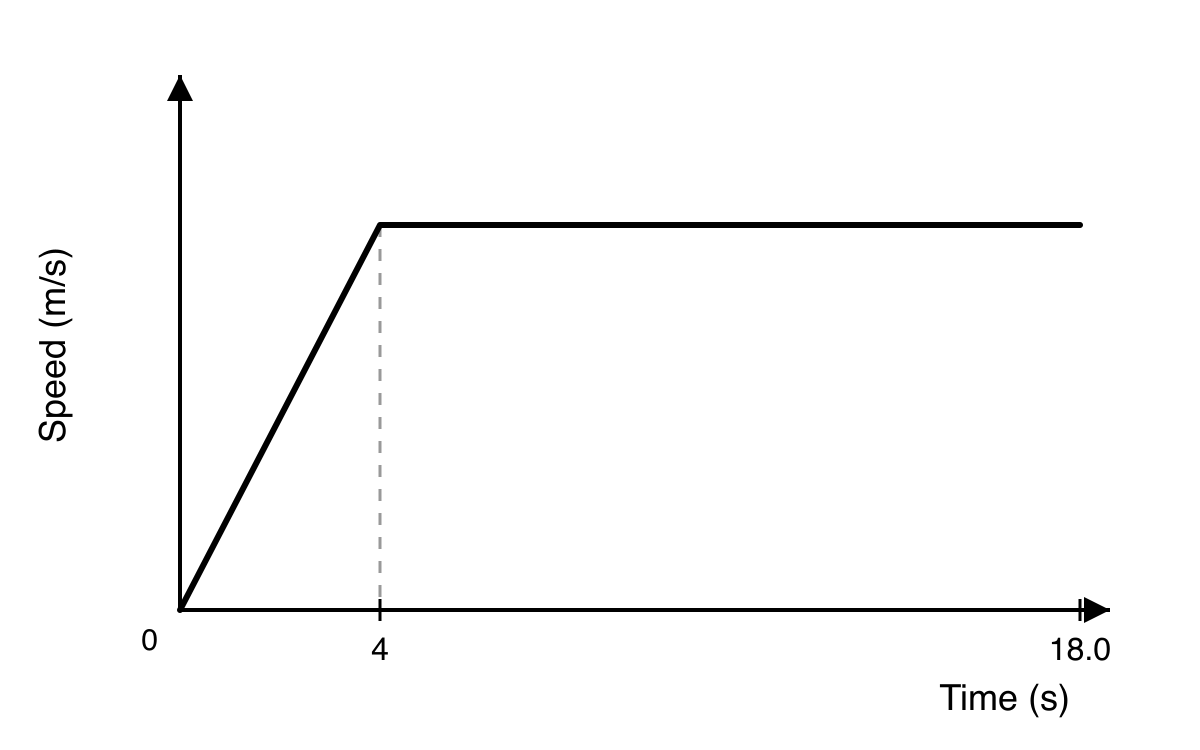
A remote-controlled car is tested on a straight track of 160 m. The total time taken for the car to finish the track is 18.0 s. The car starts from rest, accelerates uniformly for 4 seconds, and then continues at its maximum speed. Below is a sketch of the speed-time graph for the car's journey.
a.[4]
Work out the maximum speed of the car during the test.
b.[2]
Calculate the distance covered by the car during the acceleration phase (the first 4 seconds).
Velocity Time Graphs Questions
23 exam-style questions on Eduqas GCSE Maths Velocity Time Graphs. Each one has a worked solution and a mark scheme showing where the marks go.