Question 2
69%A bus travels along a straight road between two stops. The speed-time graph for the journey is shown below.
- The bus accelerates from 0 m/s to 15 m/s in 40 seconds40\text{ seconds}40 seconds.
- It travels at a constant speed of 15 m/s for a further 100 seconds100\text{ seconds}100 seconds.
- It then decelerates to a stop at time T secondsT\text{ seconds}T seconds.
The bus travels a total distance of 3 km during the journey.
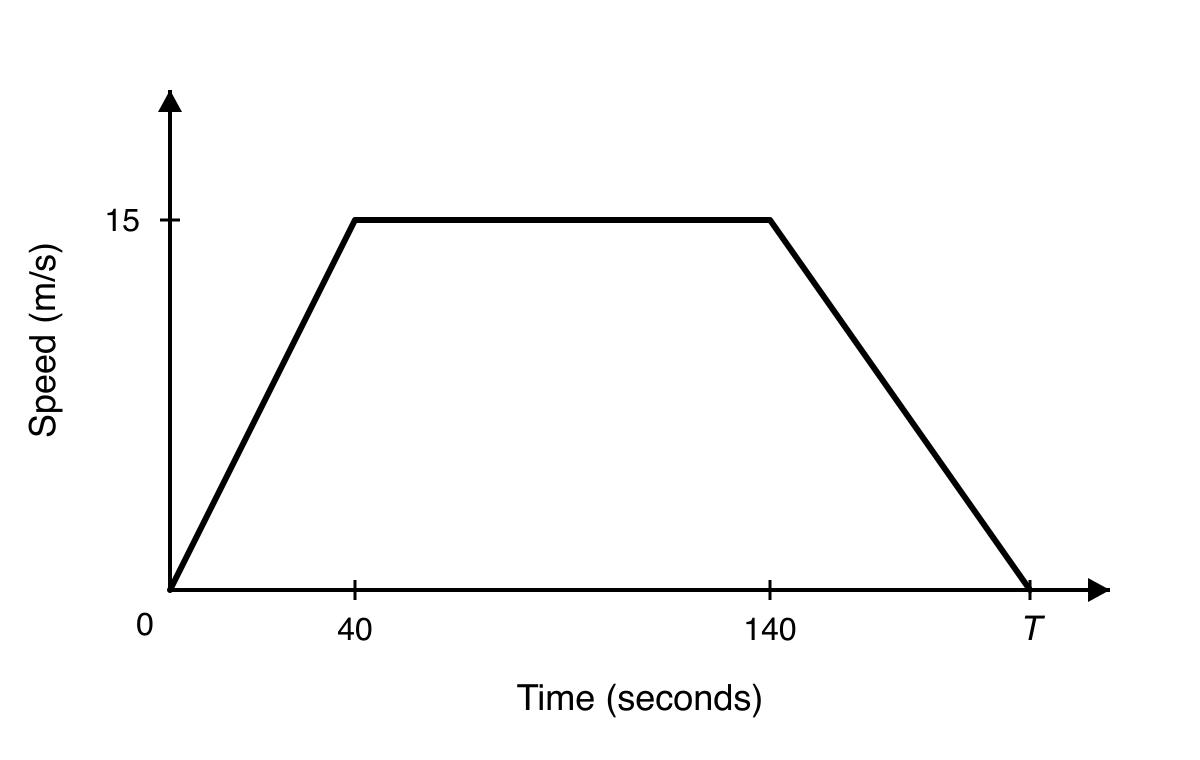
Work out the value of TTT.
Velocity Time Graphs Questions
23 exam-style questions on Eduqas GCSE Maths Velocity Time Graphs. Each one has a worked solution and a mark scheme showing where the marks go.