Question 27
Liam collected data on the maximum daily temperature and the number of ice creams sold at his shop over 10 days. He plotted the data on a scatter graph.
Liam's graph shows 'Ice Creams Sold' on the y-axis and 'Temperature (∘C^{\circ}\text{C}∘C)' on the x-axis. On the y-axis, the increments are 0,20,40,80,100,1200, 20, 40, 80, 100, 1200,20,40,80,100,120. He has drawn a line of best fit that connects the first plotted point to the last plotted point.
| Temperature (∘C^{\circ}\text{C}∘C) | Ice Creams Sold |
|---|---|
| 12 | 15 |
| 14 | 22 |
| 15 | 28 |
| 18 | 40 |
| 20 | 45 |
| 22 | 58 |
| 24 | 65 |
| 25 | 70 |
| 28 | 85 |
| 30 | 98 |
Liam has plotted the points accurately.
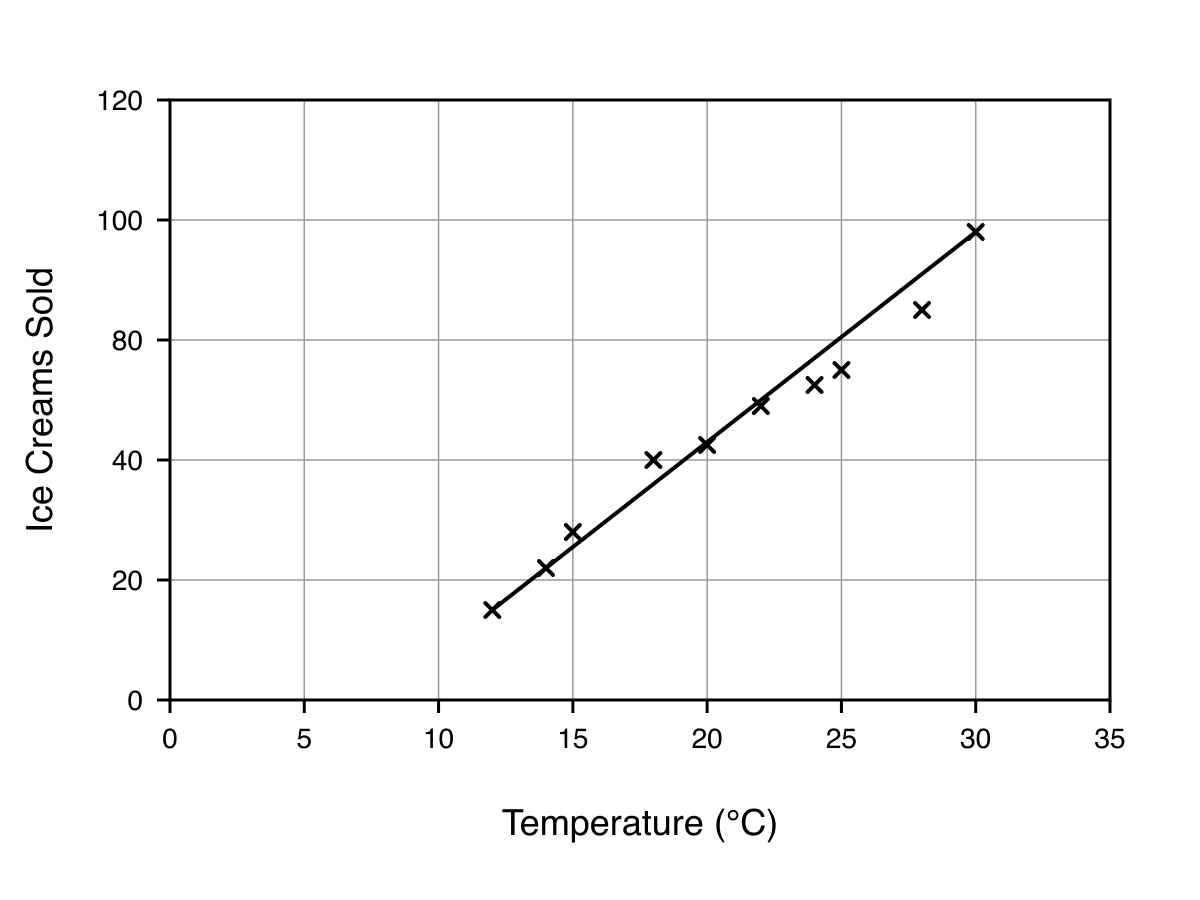
Write down two things that are wrong with his answer.
Scatter Graphs Questions
54 exam-style questions on Eduqas GCSE Maths Scatter Graphs. Each one has a worked solution and a mark scheme showing where the marks go.