Stage 8 Test C
Question 1
Dawn drove from London to Birmingham. She made one stop at a service station.
Here is part of Dawn's travel graph.
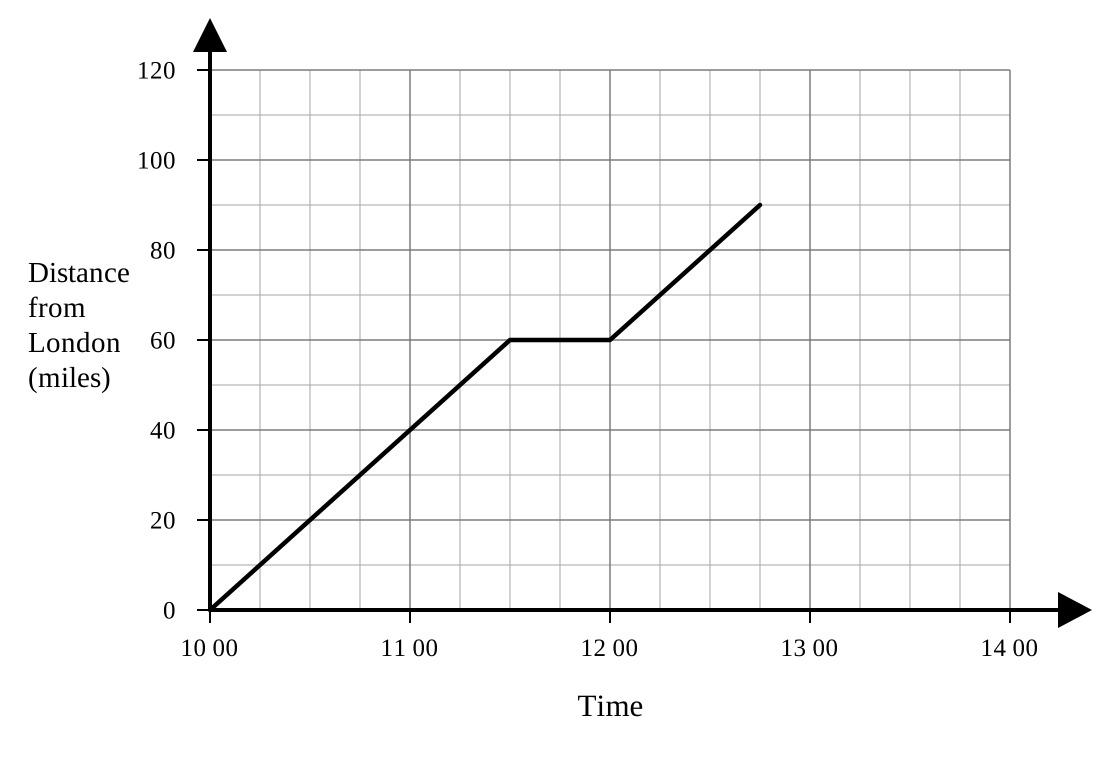
| Time | Distance from London (miles) |
|---|---|
| 10 00 | 0 |
| 11 30 | 60 |
| 12 00 | 60 |
| 12 45 | 90 |
a.[1]
For how many minutes did Dawn stop at the service station?
b.[2]
What was Dawn's average speed between London and the service station?
Question 2
In a sale, the normal price of a car is reduced by 30%. The sale price of the car is £5950
Work out the normal price of the car.
Question 3
a.[1]
Write 3.71 × 10⁻⁵ as an ordinary number.
b.[1]
Write 9 million in standard form.
c.[2]
Calculate (4.3×105)×(3.5×10−2)(4.3 \times 10^5) \times (3.5 \times 10^{-2})(4.3×105)×(3.5×10−2) Give your answer in standard form.
Question 4
Expand and simplify (4x−3)(x−2)(4x - 3)(x - 2)(4x−3)(x−2)
Question 5
Andrew ran 3.1 miles in 17 minutes and 25 seconds.
He assumes he can run 8 miles at the same speed.
Work out how long it would take Andrew to run 8 miles.
Give your answer in minutes and seconds to the nearest second.
Question 6
Solve b2−10b+24=0b^2 - 10b + 24 = 0b2−10b+24=0
Question 7
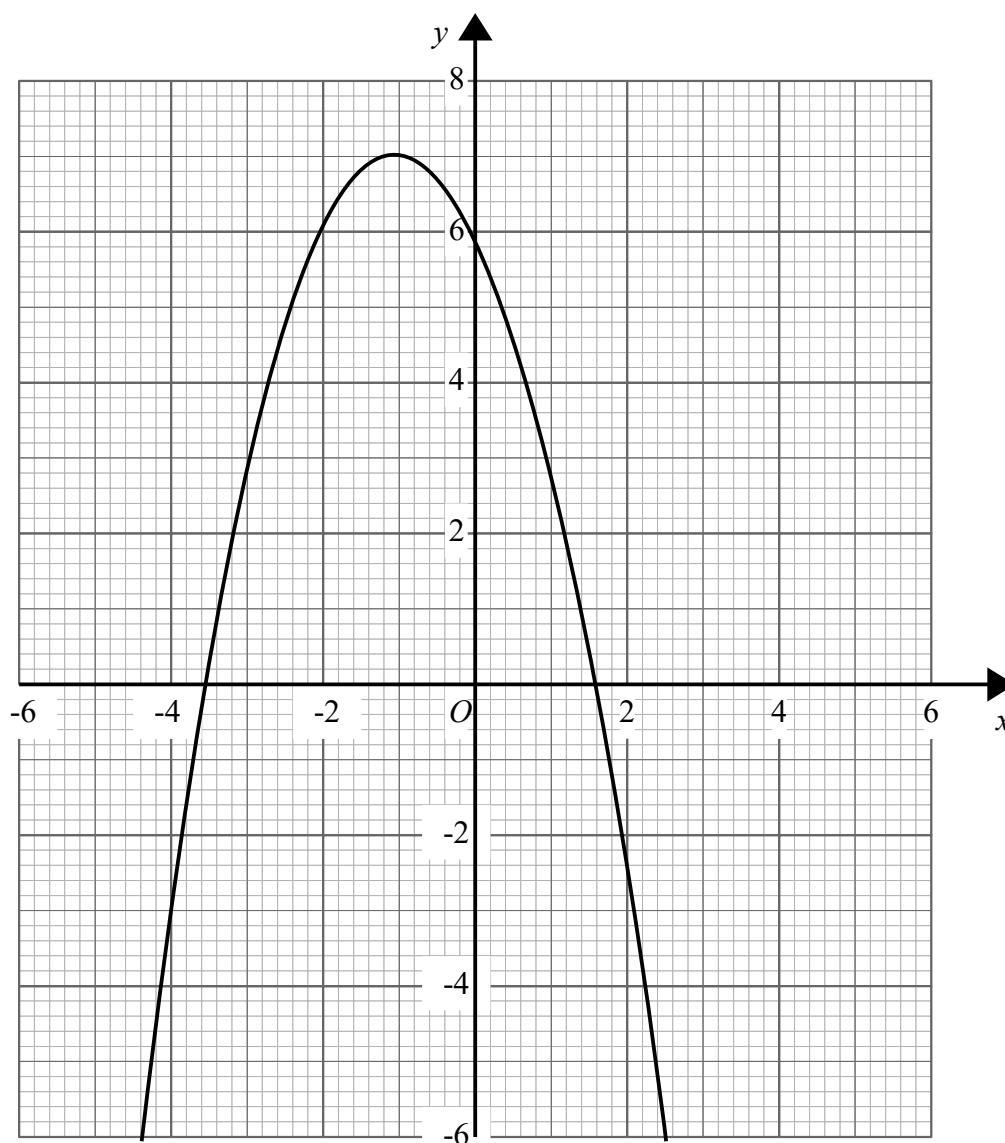
Here is the graph of y=6−2x−x2y = 6 - 2x - x^2y=6−2x−x2
a.[1]
Write down the turning point of the graph y=6−2x−x2y = 6 - 2x - x^2y=6−2x−x2
b.[2]
Use the graph to find the roots of the equation x2+2x=6x^2 + 2x = 6x2+2x=6
Question 8
a.
[2]
Complete the table of values for y=x3+x−2y = x^3 + x - 2y=x3+x−2
| xxx | -2 | -1 | 0 | 1 | 2 |
| yyy |
b.[2]
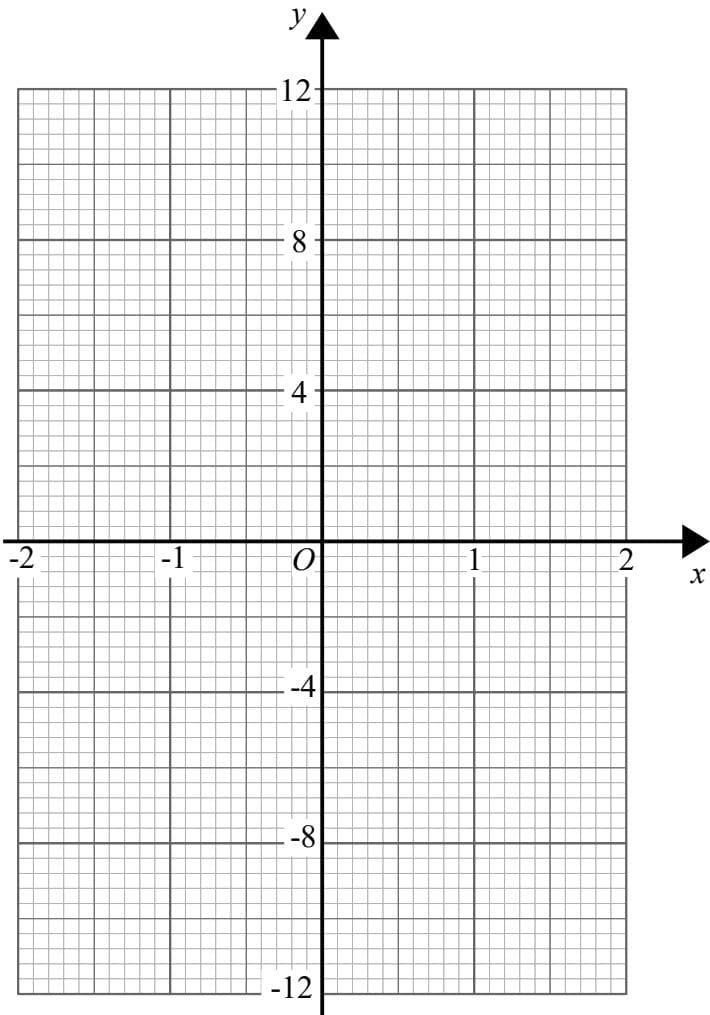
On the grid, draw the graph of y=x3+x−2y = x^3 + x - 2y=x3+x−2