Question 8
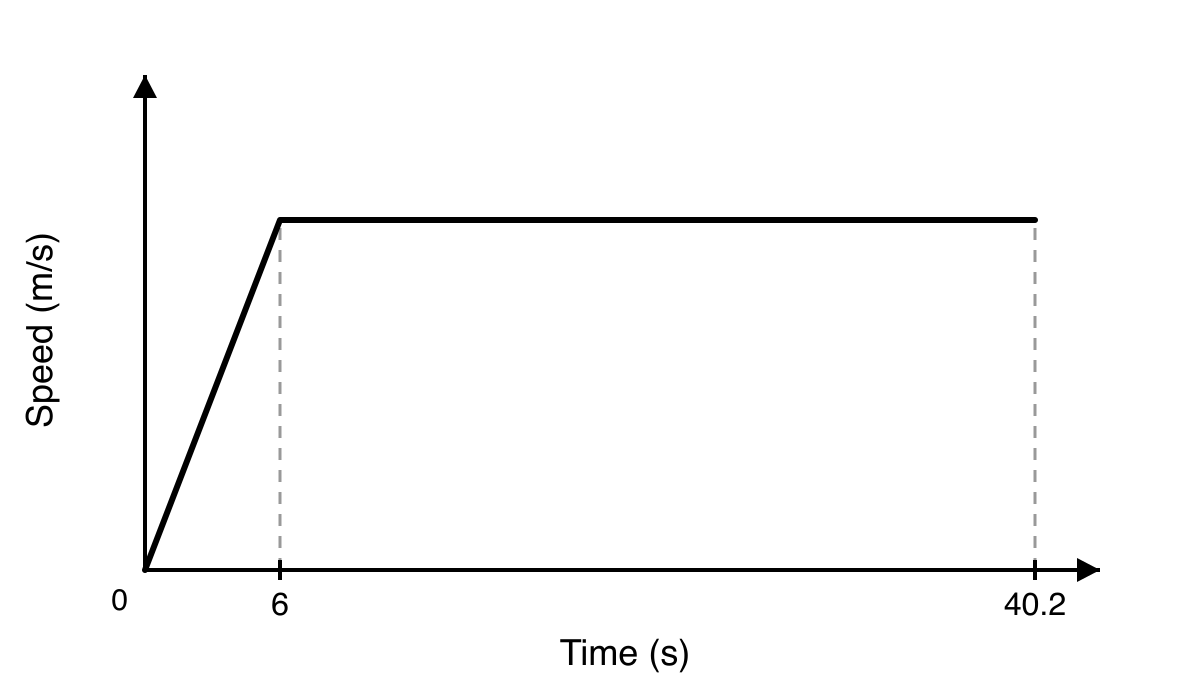
A horse gallops along a 600 m course. The total time taken to finish the course is 40.2 s. The horse accelerates from rest for the first 6 seconds until it reaches its maximum speed, which it then maintains until the finish line. Below is a sketch of the speed-time graph for the horse.
a.[4]
Work out the maximum speed reached by the horse during the gallop.
b.[2]
Calculate the distance covered by the horse during its 6-second acceleration phase.
Velocity Time Graphs Questions
23 exam-style questions on Edexcel GCSE Maths Velocity Time Graphs. Each one has a worked solution and a mark scheme showing where the marks go.