Question 4
The number of emails received by 15 employees in a morning are shown below.
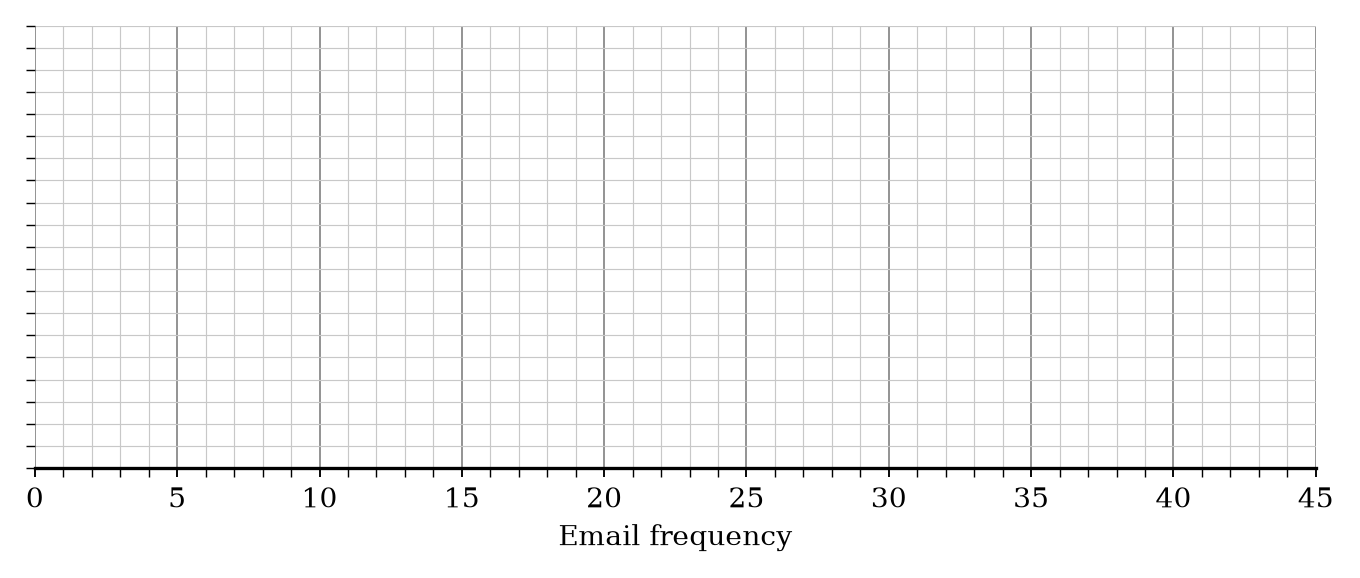
101215182022242527293032353840 10 \quad 12 \quad 15 \quad 18 \quad 20 \quad 22 \quad 24 \quad 25 \quad 27 \quad 29 \quad 30 \quad 32 \quad 35 \quad 38 \quad 40 101215182022242527293032353840Draw a box plot for this information.
Box Plots Questions
27 exam-style questions on Edexcel GCSE Maths Box Plots. Each one has a worked solution and a mark scheme showing where the marks go.