Question 2
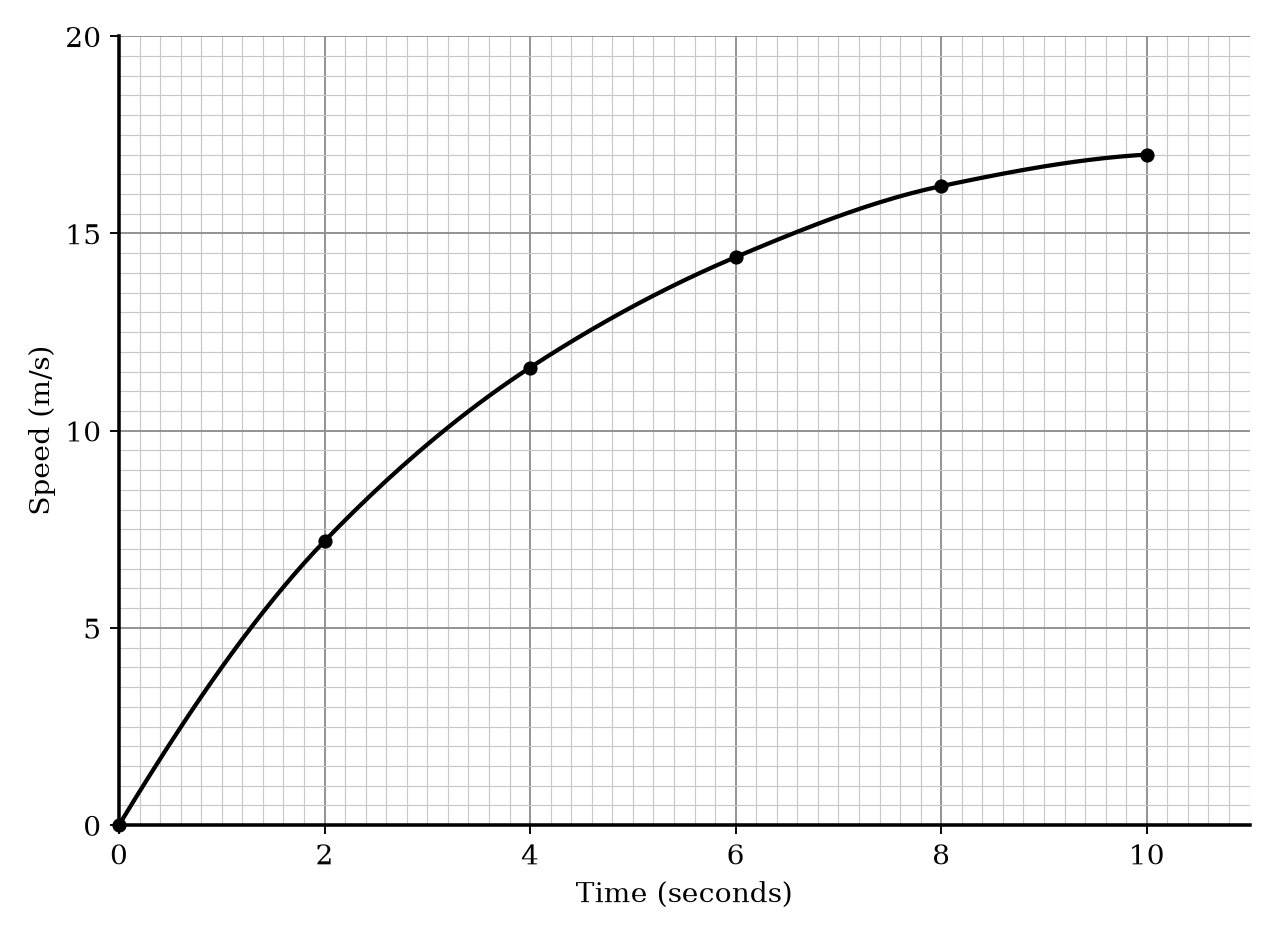
A speed-time graph for a cyclist accelerating from rest is shown. The graph passes through the points (0,0)(0, 0)(0,0), (2,7.2)(2, 7.2)(2,7.2), (4,11.6)(4, 11.6)(4,11.6), (6,14.4)(6, 14.4)(6,14.4), (8,16.2)(8, 16.2)(8,16.2), and (10,17.0)(10, 17.0)(10,17.0).
a.[3]
Use 5 strips of equal width to find an estimate for the distance travelled in 10 seconds.
b.[1]
Is your answer to (a) an underestimate or an overestimate of the actual distance? Give a reason for your answer.
Velocity Time Graphs Questions
23 exam-style questions on AQA GCSE Maths Velocity Time Graphs. Each one has a worked solution and a mark scheme showing where the marks go.