Question 63
The bar chart shows how many hours of homework 30 students did last week.
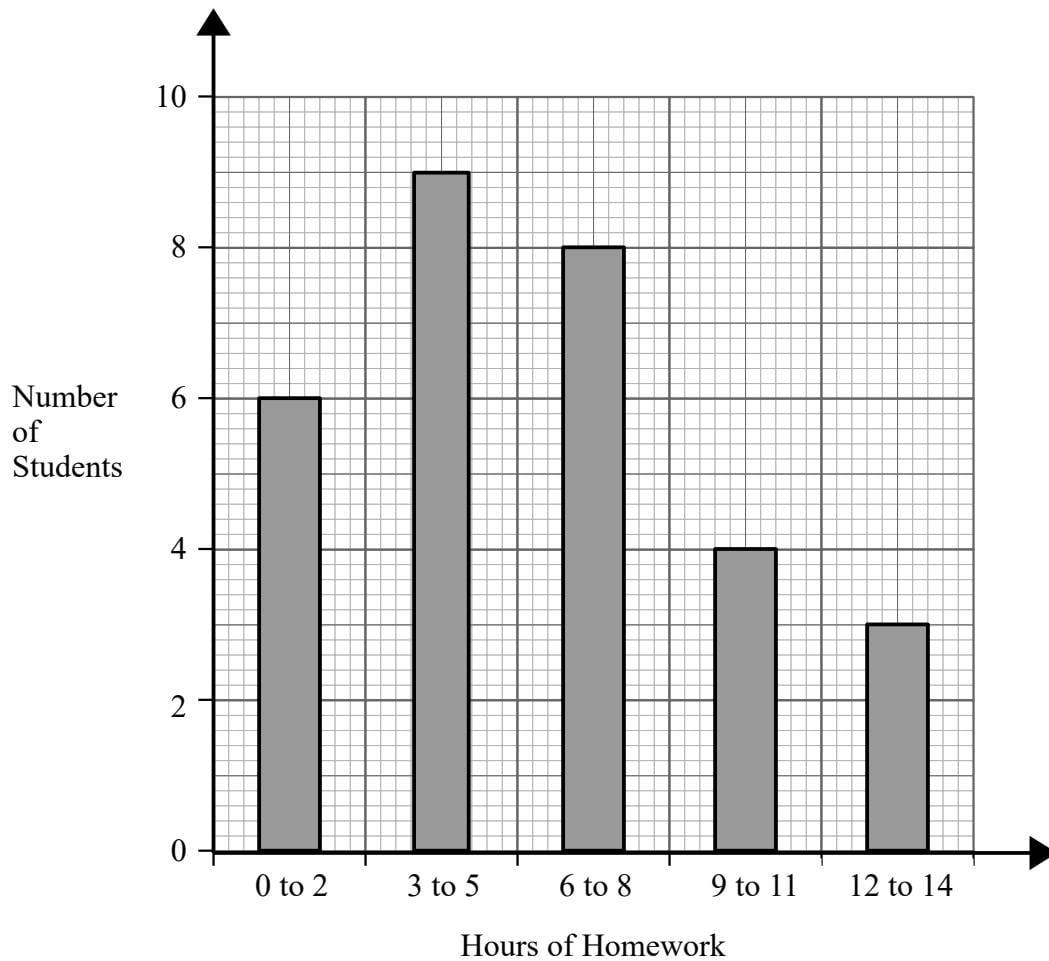
| Hours of Homework | Number of Students |
|---|---|
| 0 to 2 | 6 |
| 3 to 5 | 9 |
| 6 to 8 | 8 |
| 9 to 11 | 4 |
| 12 to 14 | 3 |
Calculate an estimate for the mean number of hours of homework.
Averages from Frequency Tables Questions
111 exam-style questions on AQA GCSE Maths Averages from Frequency Tables. Each one has a worked solution and a mark scheme showing where the marks go.