Question 8
The pie chart shows information about the favourite primary and secondary colors of a group of art students.
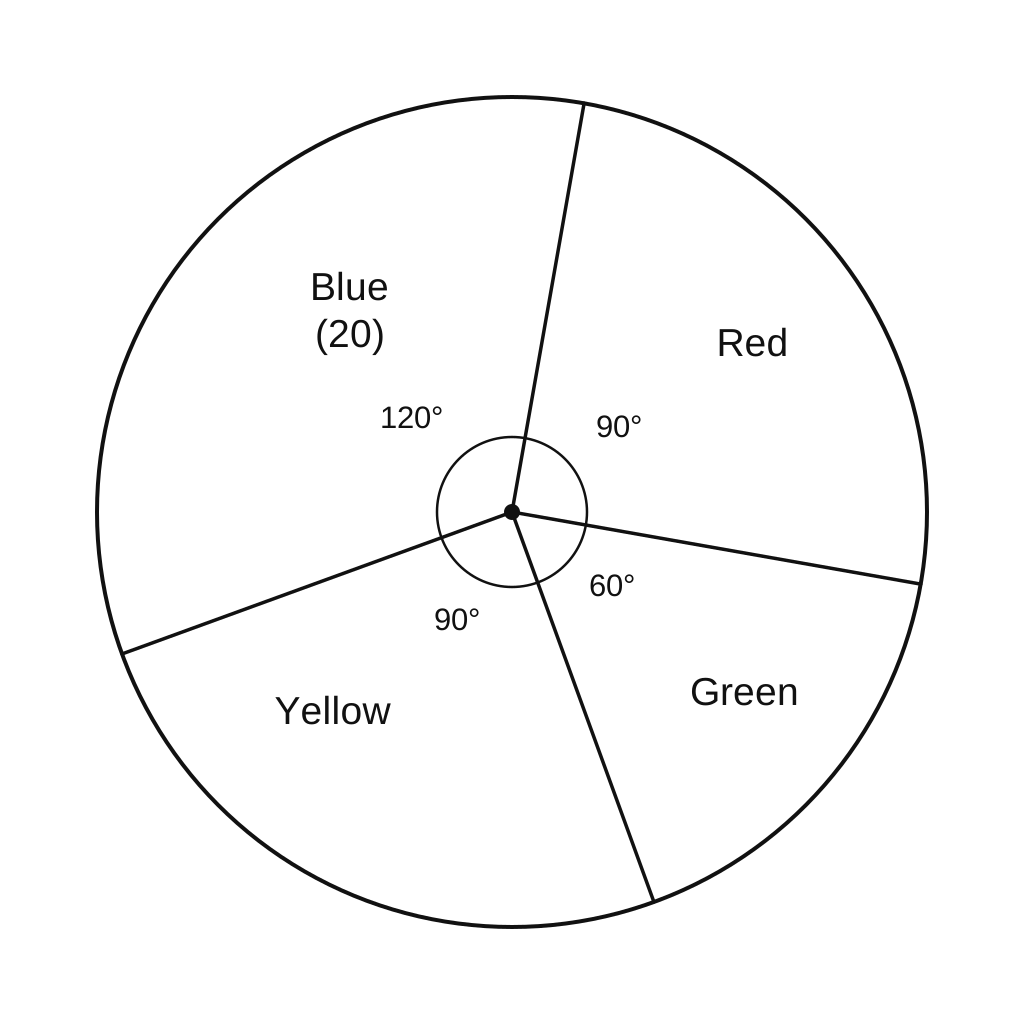
Use the pie chart to complete the table
| Color | Frequency | Angle of Sector |
|---|---|---|
| Blue | 20 | |
| Red | ||
| Green | ||
| Yellow |
Complete the table using the information from the pie chart.
Pie Charts Questions
30 exam-style questions on AQA GCSE Maths Pie Charts. Each one has a worked solution and a mark scheme showing where the marks go.