Question 20
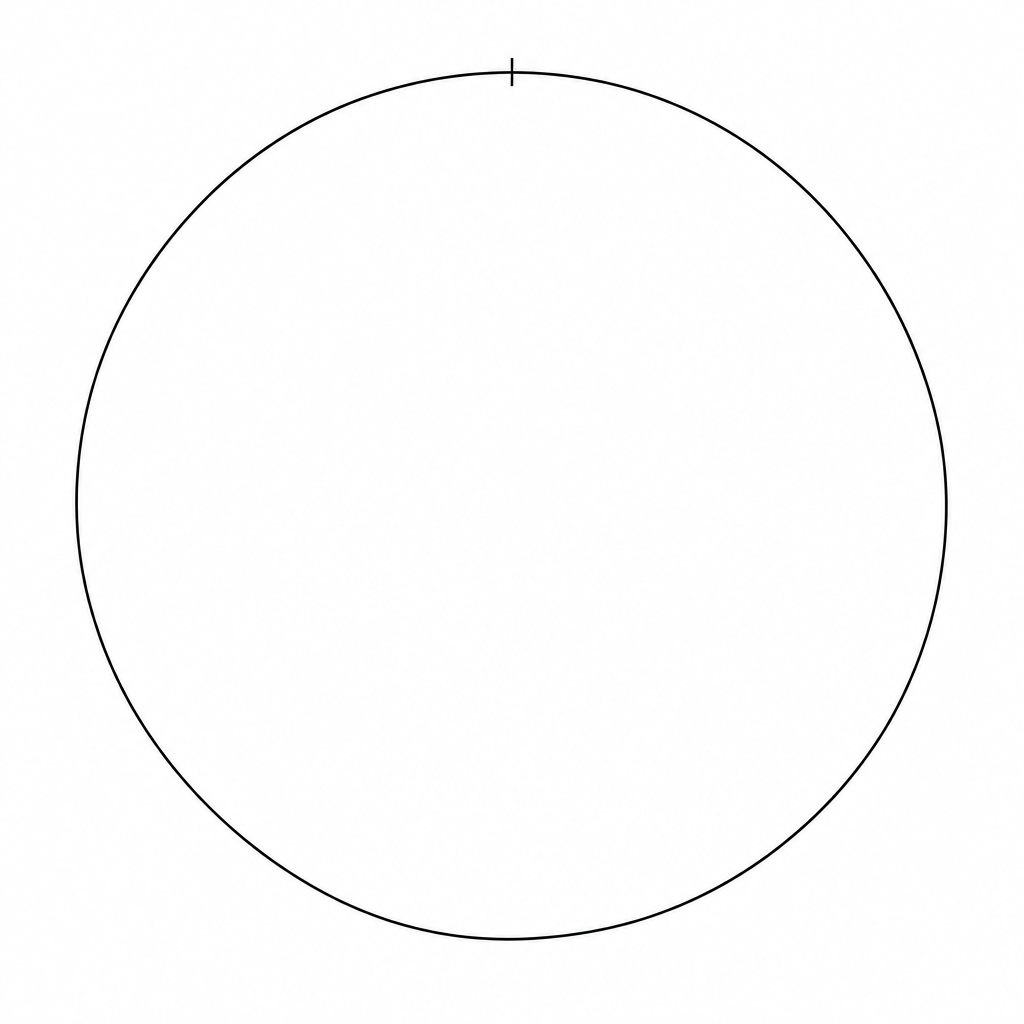
The table shows the number of different fruits sold in a shop in one hour.
| Fruit | Frequency |
|---|---|
| Apples | 50 |
| Bananas | 40 |
| Oranges | 20 |
| Pears | 10 |
a.[2]
What fraction of the fruits were Oranges? Give your answer in its simplest form.
b.[4]
Draw an accurate pie chart to show this information.
Pie Charts Questions
30 exam-style questions on AQA GCSE Maths Pie Charts. Each one has a worked solution and a mark scheme showing where the marks go.