Question 9
The table gives information about how workers at Company A travel to work.
| Method of Travel | Walk | Bus | Car |
|---|---|---|---|
| Number of Workers | 30 | 18 | 12 |
a.[4]
Draw an accurate pie chart for this information.

b.[1]
The pie chart below shows information about how workers at Company B travel to work.
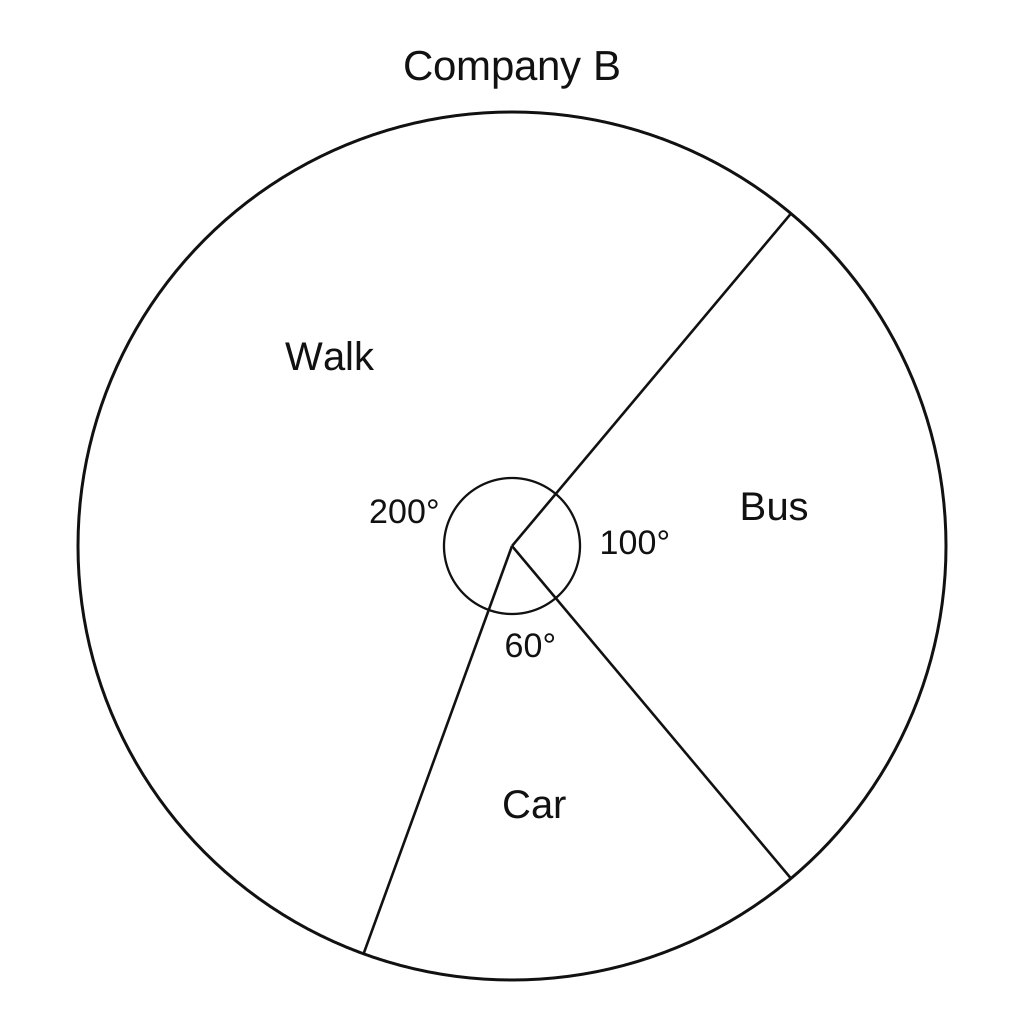
Sarah says: "The pie charts show that more workers at Company B travel by bus than at Company A."
Is Sarah right? You must explain your answer.
Pie Charts Questions
30 exam-style questions on AQA GCSE Maths Pie Charts. Each one has a worked solution and a mark scheme showing where the marks go.