Skip to content
MathsGenie logo
Quick links
Open app

Course home

  1. GCSE
  2. Geography OCR A
  3. Question bank

Using & modifying UK environments

MediumHard
12345678910
Question 10

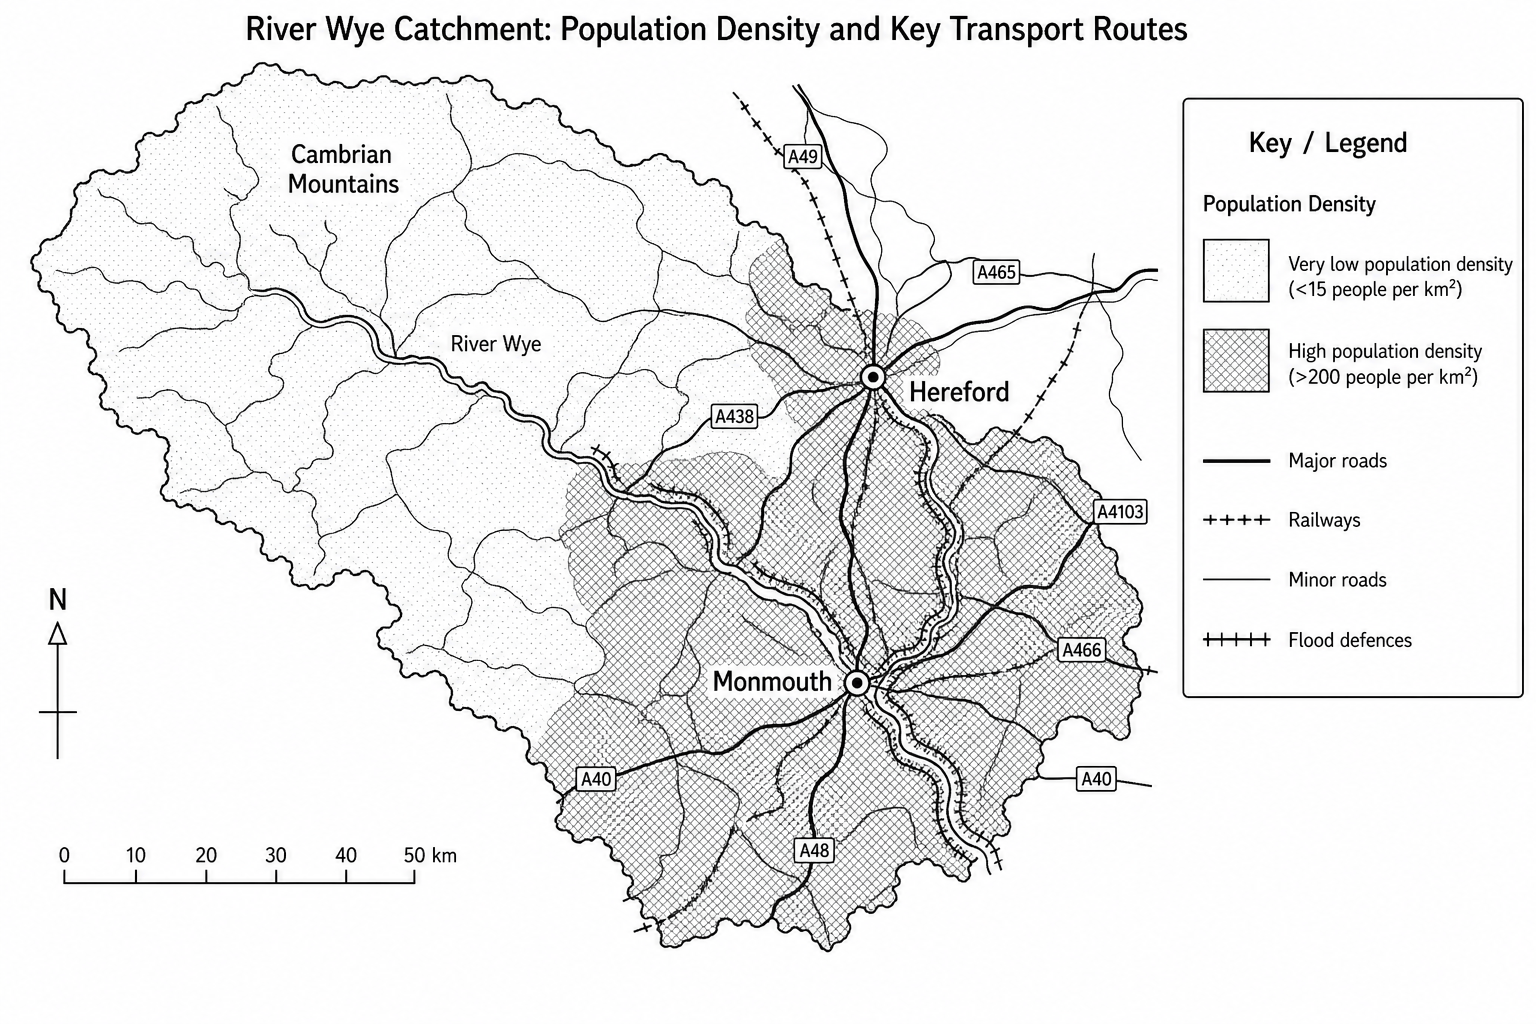
Using Figure 4 and your own knowledge, explain why the network of infrastructure (such as transport, communications, and utilities) varies across the River Wye catchment area.

Figure 4: A choropleth map of the River Wye catchment showing population density and key transport routes. The northern and western headwaters in the steep Cambrian Mountains show very low population density (fewer than 15 people per km²) with only a few minor, winding roads. In contrast, the flatter southern and eastern parts of the catchment, particularly around Hereford and Monmouth, show high population densities (over 200 people per km²) with a dense network of major A-roads, railway lines, and flood defence infrastructure.

[3]

Using & modifying UK environments Questions

  1. GCSE
  2. /Geography
  3. /Using & modifying UK environments