

What you'll learn
- What diversity, inequality and geographical patterns mean in the UK.
- How employment, income, life expectancy, education, ethnicity and broadband access vary across the UK.
- Why these patterns often overlap, especially between London/the South East, major cities, rural areas and former industrial regions.
- How to describe and compare UK inequality using evidence without overgeneralising.
Starting point: what does this key idea mean?
The UK is not the same everywhere. People’s opportunities, identities and quality of life vary between places such as London, the South East, South Wales, the North East, rural Scotland, Northern Ireland and major cities like Birmingham and Manchester.
This topic is about spotting and explaining patterns at the national scale: where things are higher or lower across the UK, and why those patterns matter.
Diversity
Diversity means variety within a population or place. In this topic, it can refer to differences in ethnicity, culture, jobs, income, education, health, age structure and access to services.
Inequality
Inequality means an uneven distribution of opportunities, wealth, services or outcomes between people or places. It does not always mean “poverty”; it means that some groups or areas have more advantages than others.
Geographical pattern
A geographical pattern is a trend that can be seen across space, such as “higher average incomes in London and the South East” or “poorer broadband access in some remote rural areas”.
The big picture
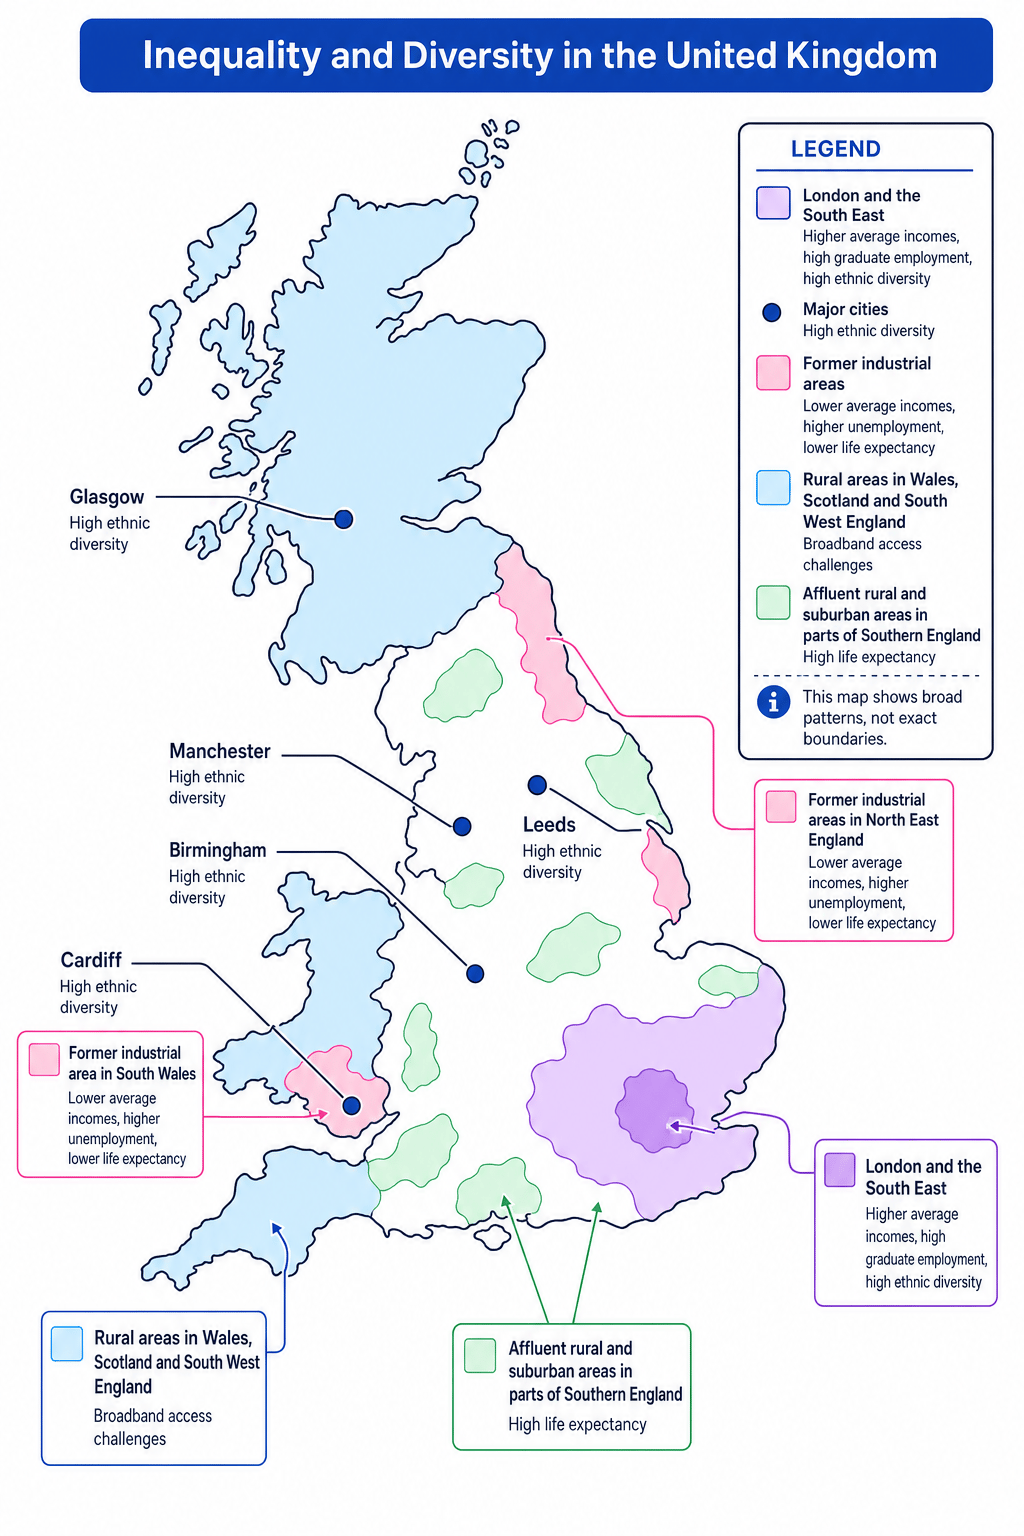
UK inequality is not random. Many indicators show a broad contrast between more prosperous areas such as London and parts of the South East, and areas facing greater challenges such as some former industrial, coastal and remote rural places. But there are also inequalities within every region.
Employment: what work people do and where jobs are found
Employment
Employment means paid work. In geography, you may look at employment rate, unemployment, job types and the sectors people work in.
The UK economy has changed a lot. In the past, many people worked in primary industry such as farming and mining, and secondary industry such as manufacturing. Today, most UK workers are in tertiary industry, which provides services, and quaternary industry, which uses knowledge and information, such as finance, research, technology and media.
Economic sectors
The primary sector extracts raw materials, the secondary sector makes products, the tertiary sector provides services, and the quaternary sector involves knowledge-based work such as IT, research and finance.
Employment patterns in the UK
London and the South East have many high-paid service and quaternary jobs, especially in finance, law, technology, media and government. Cities such as Manchester, Leeds, Edinburgh, Cardiff and Bristol have also grown as service-sector centres.
Some former industrial areas, including parts of South Wales, North East England, the North West, Yorkshire and the West Midlands, were affected by deindustrialisation.
Deindustrialisation
Deindustrialisation is the decline of manufacturing and heavy industry in an area, often leading to job losses and long-term economic change.
Deindustrialisation can leave a legacy of lower incomes, fewer skilled jobs, higher unemployment or higher economic inactivity. However, avoid saying whole regions are “poor” or “unemployed”: every region contains both wealthy and deprived areas.
Overgeneralising regions
Do not write “the North is poor and the South is rich” as if it is always true. A better answer says: “Some former industrial areas in northern England and South Wales have lower average incomes, while London and the South East have higher averages, although there are inequalities within both.”
Average income: how money varies between places
Average income
Average income is the typical amount of money earned or received by people in an area. It may be measured using mean or median income, depending on the data source.
Average incomes are usually highest in London and parts of the South East. This is linked to concentrations of high-paid jobs, company headquarters, finance, technology and professional services.
Average incomes tend to be lower in some former industrial areas, some coastal towns and some rural areas with seasonal or lower-paid work. Wales, North East England and parts of Northern Ireland often appear lower on national income maps than London and the South East, depending on the dataset used.
Mean or median?
If the data gives a mean, very high earners can pull the average upwards. A median is the middle value, so it is often better for showing the “typical” income in a very unequal place like London.
Why income patterns matter
Income affects people’s ability to access housing, transport, healthy food, education, leisure and digital technology. Higher income does not guarantee a better quality of life, but it often gives people more choices.
Life expectancy: how long people are expected to live
Life expectancy
Life expectancy is the average number of years a person is expected to live, based on current death rates.
Life expectancy varies across the UK. It is generally higher in many affluent rural and suburban areas, such as parts of southern England, and lower in some more deprived urban, coastal and former industrial areas.
The UK average is roughly around the late 70s for males and early 80s for females, but exact figures change over time and vary by local authority. The gap between the highest and lowest areas can be over 10 years, and gaps in healthy life expectancy are often even larger.
Healthy life expectancy
Healthy life expectancy is the average number of years a person can expect to live in good health.
Why health is linked to place
Life expectancy is affected by many factors, including income, housing quality, employment, education, access to healthcare, diet, smoking rates, air quality and access to green space. These factors often overlap, which is why health inequality has a clear geography.
Explaining a linked inequality pattern
- Start with a pattern: life expectancy is often lower in some deprived former industrial or coastal areas than in affluent suburban areas.
- Link this to causes: lower average incomes may limit access to healthy food, good housing and private transport, while unemployment or insecure work can increase stress.
- Add a place-based explanation: areas affected by deindustrialisation may have had long-term job losses, reducing local investment and affecting health outcomes across generations.
- Balance the answer: not everyone in a deprived area has poor health, and not everyone in an affluent area is healthy; the pattern is about averages.
Educational attainment: achievement at school and beyond
Educational attainment
Educational attainment means the level of education people achieve, such as GCSE results, A-levels, apprenticeships, degrees or other qualifications.
Educational attainment varies across the UK. London has often performed strongly in school outcomes, partly linked to investment, school improvement policies, a large labour market, and high aspirations in many communities. Some areas with lower average income, including certain coastal towns and former industrial communities, may have lower attainment on average.
Education links strongly to employment and income. People with higher qualifications are more likely to access skilled, higher-paid jobs, especially in growing service and quaternary sectors.
Comparing educational attainment data
Suppose Area A has 72% of pupils achieving a chosen GCSE benchmark, while Area B has 58%.
- Identify the type of comparison: both values are percentages, so the simplest comparison is a percentage point gap, not a percentage increase.
- Subtract the lower value from the higher value:
- Interpret it geographically: Area A has a noticeably higher level of attainment than Area B, which may affect future access to skilled employment and income.
- Avoid overclaiming: this comparison does not prove the cause of the gap; you would need extra evidence about income, schools, housing, transport or deprivation.
Percentage points versus percentage increase
If one area has 72% and another has 58%, the difference is 14 percentage points. Do not call it a 14% increase unless you have calculated percentage change from a starting value.
Ethnicity: the UK’s diverse population
Ethnicity
Ethnicity refers to a person’s cultural identity, which may include shared ancestry, language, religion, traditions and history. It is not the same as nationality.
The UK is ethnically diverse, but diversity is not evenly distributed. Major cities tend to have the greatest ethnic diversity because they have long histories of migration, large labour markets, universities, transport links and established communities.
London is the most ethnically diverse part of the UK. Birmingham, Leicester, Manchester, Bradford, Leeds, Cardiff and Glasgow also have diverse populations. Many rural areas and smaller towns have lower ethnic diversity, although this varies and is changing over time.
Why ethnicity has a geographical pattern
Migration has shaped the UK over centuries. Post-war migration from the Caribbean, South Asia and other Commonwealth countries was often linked to jobs in transport, manufacturing, textiles, healthcare and public services. More recent migration from Europe, Africa, the Middle East and Asia has added to the diversity of cities and some rural labour markets.
Ethnicity and inequality are not the same thing
Ethnic diversity describes population variety. Inequality describes uneven access to opportunities or outcomes. Some ethnic minority groups experience disadvantage in income, housing, health or employment, but you should not assume every diverse area is deprived.
Access to broadband: the digital divide
Broadband
Broadband is high-speed internet access. It allows people to work, study, shop, stream, communicate and use online services.
Digital divide
The digital divide is the gap between people and places with good access to digital technology and those with limited access.
Broadband access is generally very high across the UK, with superfast coverage available to most homes. However, access can still be weaker in some remote rural areas, including parts of rural Wales, the Scottish Highlands and Islands, Northern Ireland and South West England. The exact pattern changes as networks are upgraded.
Why rural areas can have weaker broadband
Broadband infrastructure is expensive to build in places with scattered homes, mountains, islands or long distances between settlements. Companies may prioritise densely populated urban areas because more customers can be connected for less cost.
Poor broadband can affect education, businesses, healthcare appointments, online banking and remote working. This can make existing inequalities worse.
Explaining the digital divide
- Identify the spatial pattern: urban areas usually have better broadband coverage than remote rural areas.
- Explain the cost factor: in cities, many homes and businesses are close together, so one section of infrastructure can serve many customers.
- Apply this to rural areas: in places such as the Scottish Highlands or rural Wales, homes are more spread out, so the cost per connection is higher.
- Link to inequality: weaker broadband can reduce access to online learning, job applications, remote work and digital services.
How the indicators connect
These six indicators are not separate. They often reinforce each other.
| Indicator | Often linked to | Example of a UK pattern |
|---|---|---|
| Employment | Income, education, health | High-paid service jobs cluster in London and other major cities. |
| Average income | Housing, health, opportunities | London has high average incomes but also high living costs and inequality. |
| Life expectancy | Income, housing, environment | Some deprived urban and coastal areas have lower life expectancy. |
| Educational attainment | Future employment and income | Attainment can be lower in some areas facing long-term deprivation. |
| Ethnicity | Migration, cities, culture | Major cities are usually more ethnically diverse than rural areas. |
| Broadband access | Remoteness, business, education | Some rural areas have weaker access than urban areas. |
Correlation is not proof
If two patterns overlap, such as low income and low life expectancy, they may be connected — but a map alone does not prove one caused the other. Use cautious phrases like “may be linked to” or “is likely to contribute to”.
Describing UK geographical patterns well
A strong answer does more than list places. It describes the pattern clearly, supports it with examples, and recognises exceptions.
Describing a UK inequality pattern
- Identify the overall trend: average incomes are generally higher in London and parts of the South East than in many other UK regions.
- Add named places: lower average incomes are often found in parts of Wales, North East England and some former industrial or coastal areas.
- Explain the likely reason: London has a concentration of high-paid finance, technology, government and professional jobs, while some former industrial areas experienced job losses through deindustrialisation.
- Add nuance: London also contains areas of severe deprivation, and some places outside the South East are prosperous, so the pattern is not a simple north-south divide.
Use the pattern phrase: generalise, locate, qualify
For a map question, try: “Generally…, especially in…, whereas…, although…” This helps you describe the pattern and include exceptions.
Summary: what you need to remember
The UK is diverse because its population, jobs, cultures and services vary from place to place. It is unequal because opportunities and outcomes are not evenly shared. Employment, income, life expectancy, education, ethnicity and broadband access all show geographical patterns at the national scale.
The most important exam skill is to link what the pattern is, where it is found, and why it may exist, using named UK places and careful language.
In the exam
- Describe patterns using named places and direction: for example, “London and the South East”, “South Wales”, “North East England”, “rural Scotland” or “major cities”.
- Link indicators together: employment can affect income, income can affect health, and broadband can affect education and work opportunities.
- Avoid sweeping statements. Use words like “generally”, “often”, “some areas” and “on average” because UK inequalities vary within regions.
- If comparing percentages, say “percentage points” for a simple difference between two percentages.
- For longer answers, include both diversity and inequality: they are related topics, but they do not mean the same thing.
Check yourself
- What is the difference between diversity and inequality?
- Why do London and the South East often have higher average incomes than many other UK regions?
- How can poor broadband access in rural areas increase inequality?

