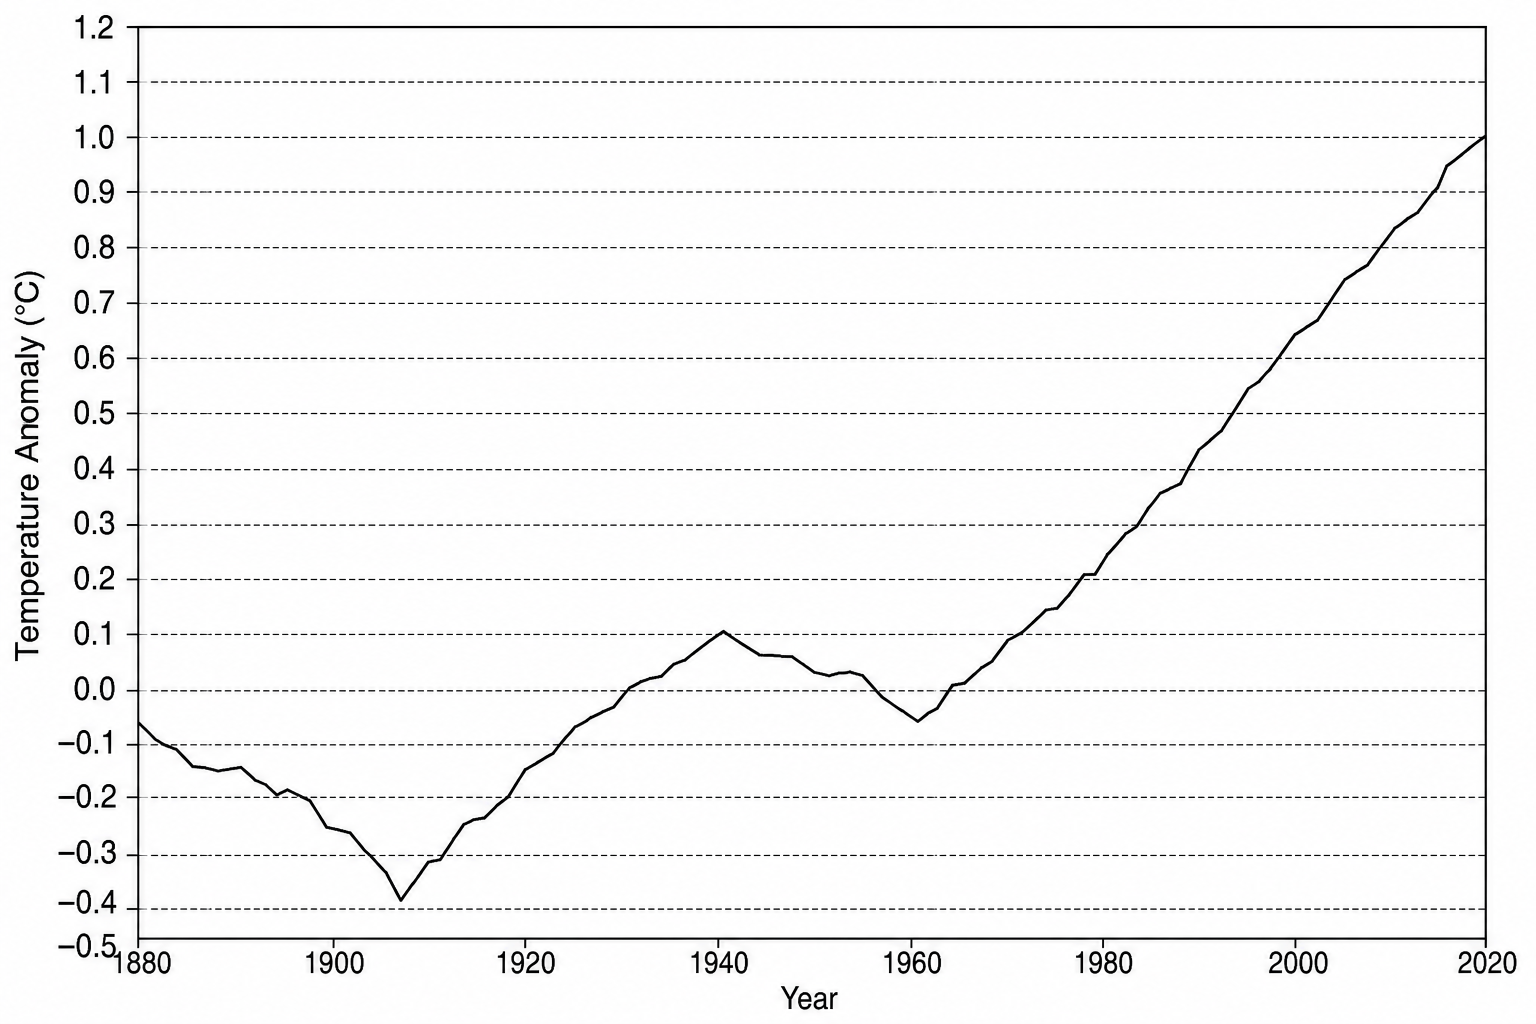
Using Figure 1, calculate the range of global temperature anomalies shown between 1880 and 2020. You must show your working.
Draw on this