A price change slides you along the curve
Definition
Movement along the demand curve: a change from one point on the curve to another point on the same curve, caused only by a change in the good's own price.
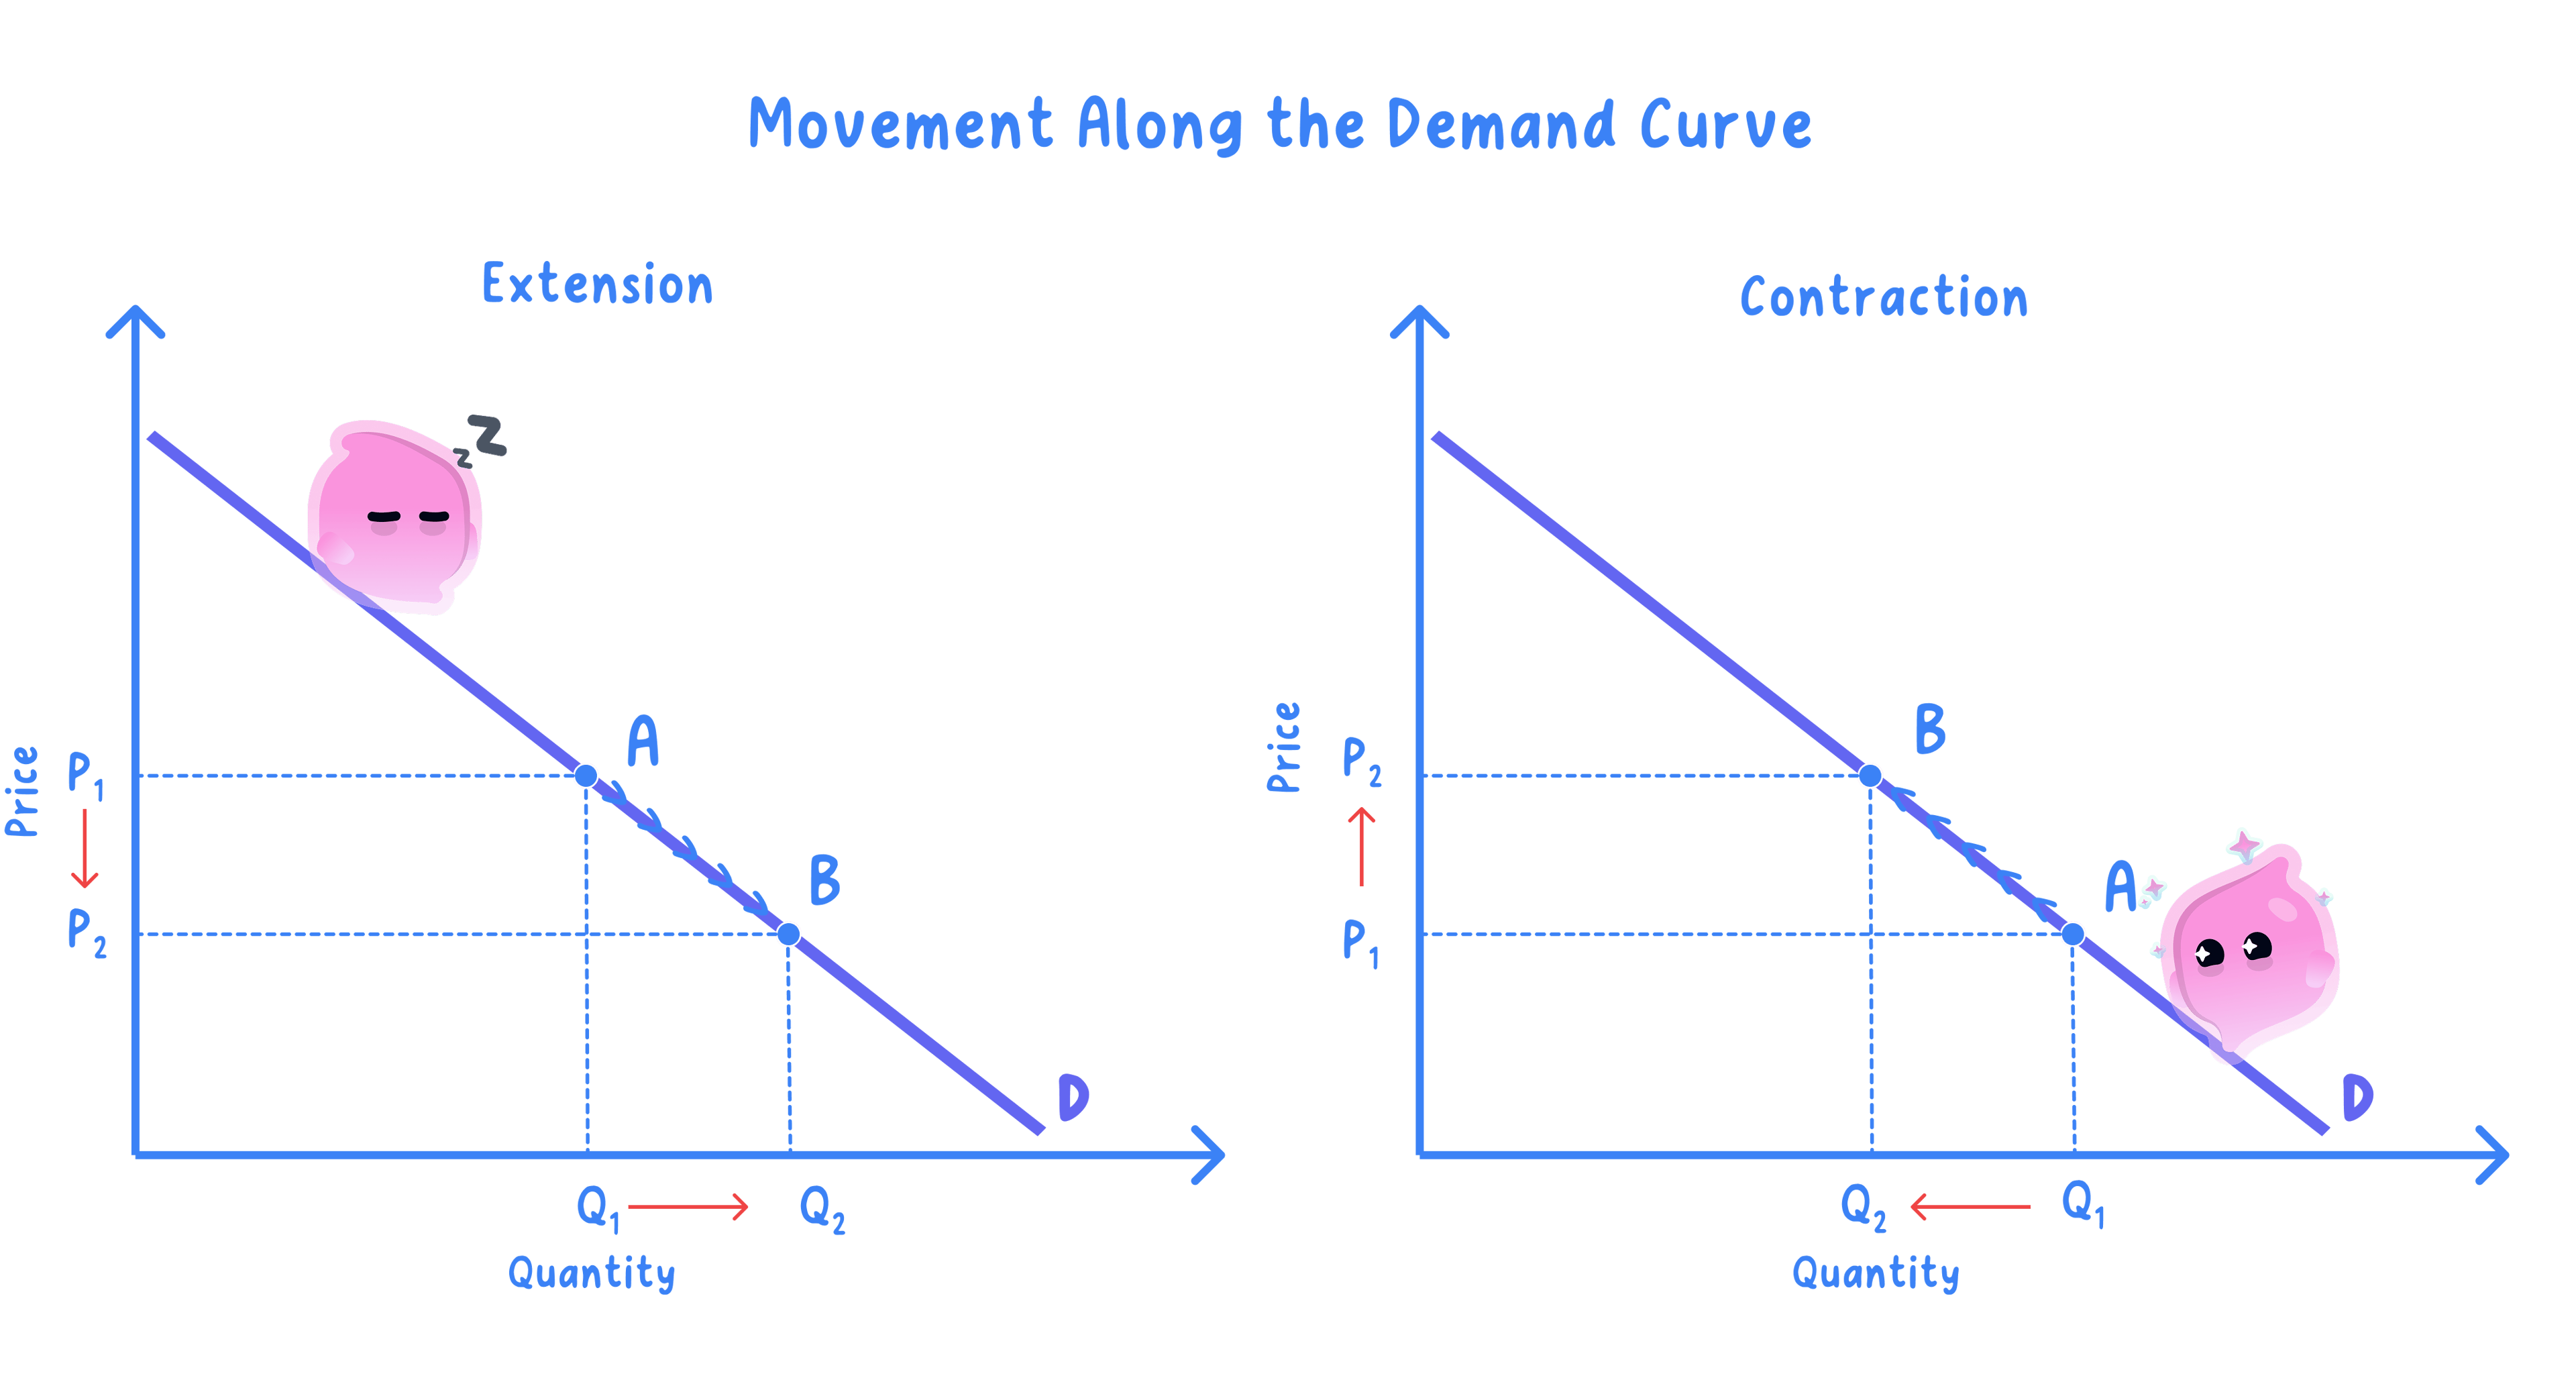
Extension of demand: a rise in quantity demanded after a fall in the good's own price, shown by sliding down the curve to the right.
Contraction of demand: a fall in quantity demanded after a rise in the good's own price, shown by sliding up the curve to the left.
- The curve does not move and the label D stays put; what moves is the point being read.
- Mark the two points A and B, and label P1, P2, Q1 and Q2 so the coordinates you moved between are visible.
A shift moves the whole curve sideways
Definition
Shift of demand: a move of the whole curve to a new position, caused by a change in something other than the good's own price, so a different quantity is demanded at every price.
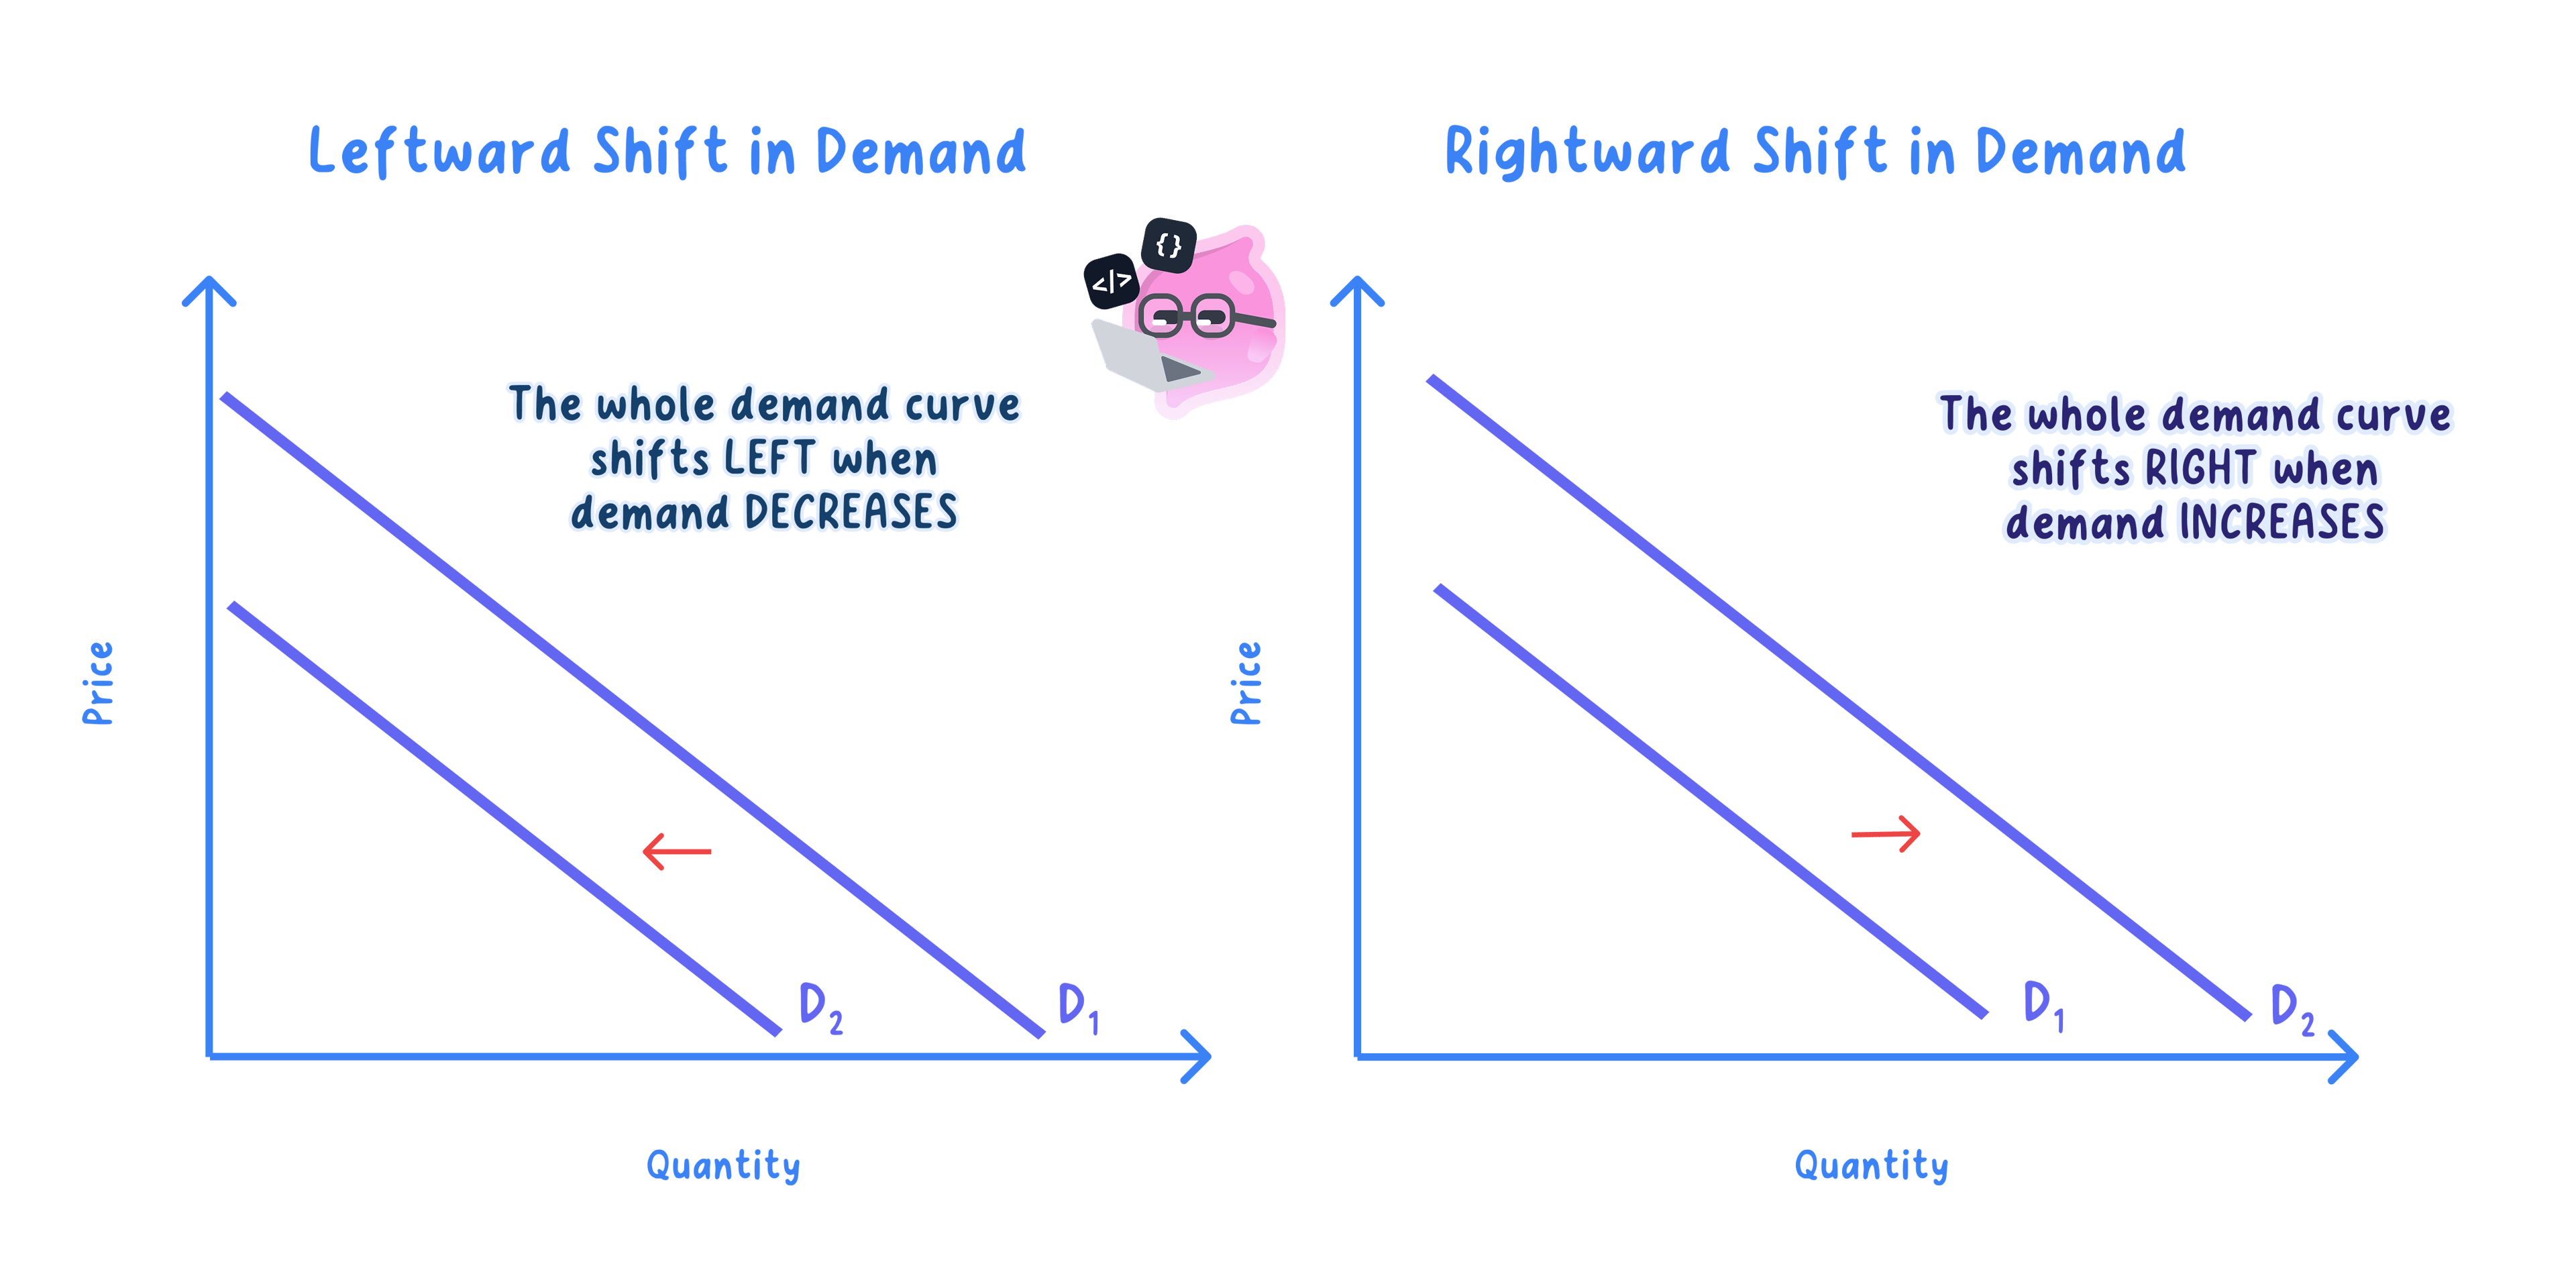
- An increase in demand moves the whole curve to the right, so a larger quantity is demanded at every price.
- A decrease in demand moves it to the left, so a smaller quantity is demanded at every price.
- Draw the second curve as a complete line roughly parallel to the first, label the original D1 and the new one D2, and add an arrow showing which way it has gone.
Example
- A high street coffee shop after new offices open nearby: the schedule shows cups a day before and after the offices filled up, with menu prices left alone.
| Price per cup | Cups a day before | Cups a day after |
|---|---|---|
| £3.00 | 250 | 400 |
| £2.00 | 400 | 560 |
Step 1: at £3.00, subtract the old quantity from the new one:
400−250=150 cups a day 400 - 250 = 150\text{ cups a day} 400−250=150 cups a dayStep 2: do the same at £2.00:
560−400=160 cups a day 560 - 400 = 160\text{ cups a day} 560−400=160 cups a day- More is wanted at both prices with no price change, so the whole curve has shifted right from D1 to D2: an increase in demand.
One test decides which of the two to draw
- Find the change the question describes and ask a single question: is it the price of this good?
- If it is, slide along the existing curve and call it an extension or a contraction.
- If it is anything else, draw a second curve and call it an increase or a decrease in demand.
- Watch for a related good, because the price of a substitute or a complement is not the price of this good and so shifts this curve.
Common Mistake
- Do not draw a second curve for a price cut, since only a non-price factor gives a new curve.
- Do not describe a shift as demand becoming cheaper, because a shift happens with the price left exactly where it was.
The vocabulary has to match the diagram
- Use increase and decrease for a shift, and extension and contraction for a movement, since the words are not interchangeable.
- Say what caused the change in the same sentence, because the cause is what proves you chose the right diagram.
Exam technique
- Label both axes and the curve D before showing any change, because an unlabelled curve earns nothing.
- Show a movement as two labelled points on one curve, and a shift as a second complete curve with an arrow.
Self review
- What is the only cause of a movement along the demand curve?
- How is an increase in demand shown on a diagram?
- Using the coffee shop figures, how many more cups a day were demanded at £2.00 after the offices opened?
- The price of a substitute falls. Is that a shift or a movement, and why?
- What is the difference between a contraction of demand and a decrease in demand?
