The demand curve slopes down for three reasons
Definition
Law of demand: the rule that price and quantity demanded move in opposite directions, other things being equal.
- A lower price brings in buyers who could not afford the good before, so more people become willing and able to buy it.
- A lower price also makes the good cheaper against the goods it competes with, so some buyers switch across to it.
- People already buying tend to take extra units, because each further unit now costs them less than before.
- All three push the same way, which is why the curve falls from left to right rather than rising.
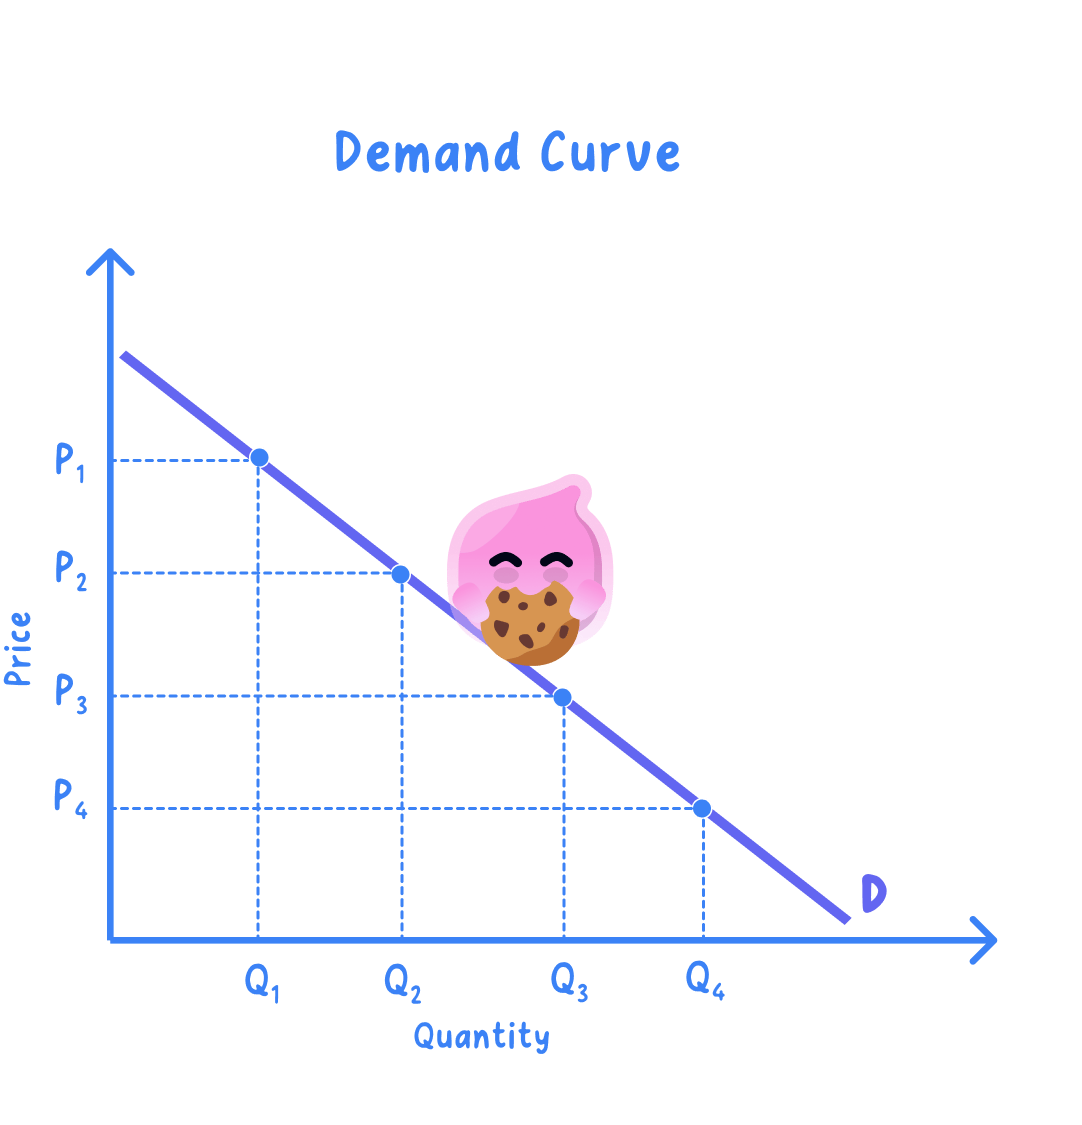
Every point pairs one price with one quantity
- Reading the curve means going across from a price on the vertical axis until you meet the line, then down to the quantity.
- That pair is a quantity demanded, so a point describes one buying plan and the whole line describes all of them.
- Two points on the same curve therefore answer the question of what would happen at a different price, with nothing else changed.
Example
- Using the market schedule from 2.2.2, read the effect of a price cut from £10 to £8.
| Price per ticket | Market demand |
|---|---|
| £12 | 1 |
| £10 | 3 |
| £8 | 5 |
| £6 | 8 |
Step 1: read the quantity at each price, which is 3 tickets at £10 and 5 tickets at £8.
Step 2: subtract to find the change:
5−3=2 tickets a month 5 - 3 = 2\text{ tickets a month} 5−3=2 tickets a month- A £2 price cut raises quantity demanded by 2 tickets a month, and both figures come from the same curve because only price has changed.
Market demand shows a producer the whole picture
- A firm sells to everyone in the market at once, so the market curve is the one its pricing decision actually meets.
- The market curve is flatter than any single buyer's, because a price change moves more buyers in total.
- Individual demand still matters for explaining why the market curve slopes down, since the market total is built from individual choices.
Exam technique
- Give a reason the curve slopes down rather than repeating that it does, because the explanation is what carries the marks.
- Quote both figures when a question gives you data, since an answer without the numbers is describing rather than explaining.
Self review
- State the law of demand.
- Give two reasons a demand curve slopes downwards.
- Using the market schedule, how many tickets are demanded at £12?
- How do you read a quantity demanded off a demand curve?
- Why is the market demand curve the one a producer needs?
