Steepness on the diagram shows the elasticity
- Both curves rise, so elasticity changes how steep the line is and never which way it slopes.
- A steep supply curve is inelastic, because a large price rise brings out only a little extra output.
- A shallow supply curve is elastic, because a small price rise brings out a lot.
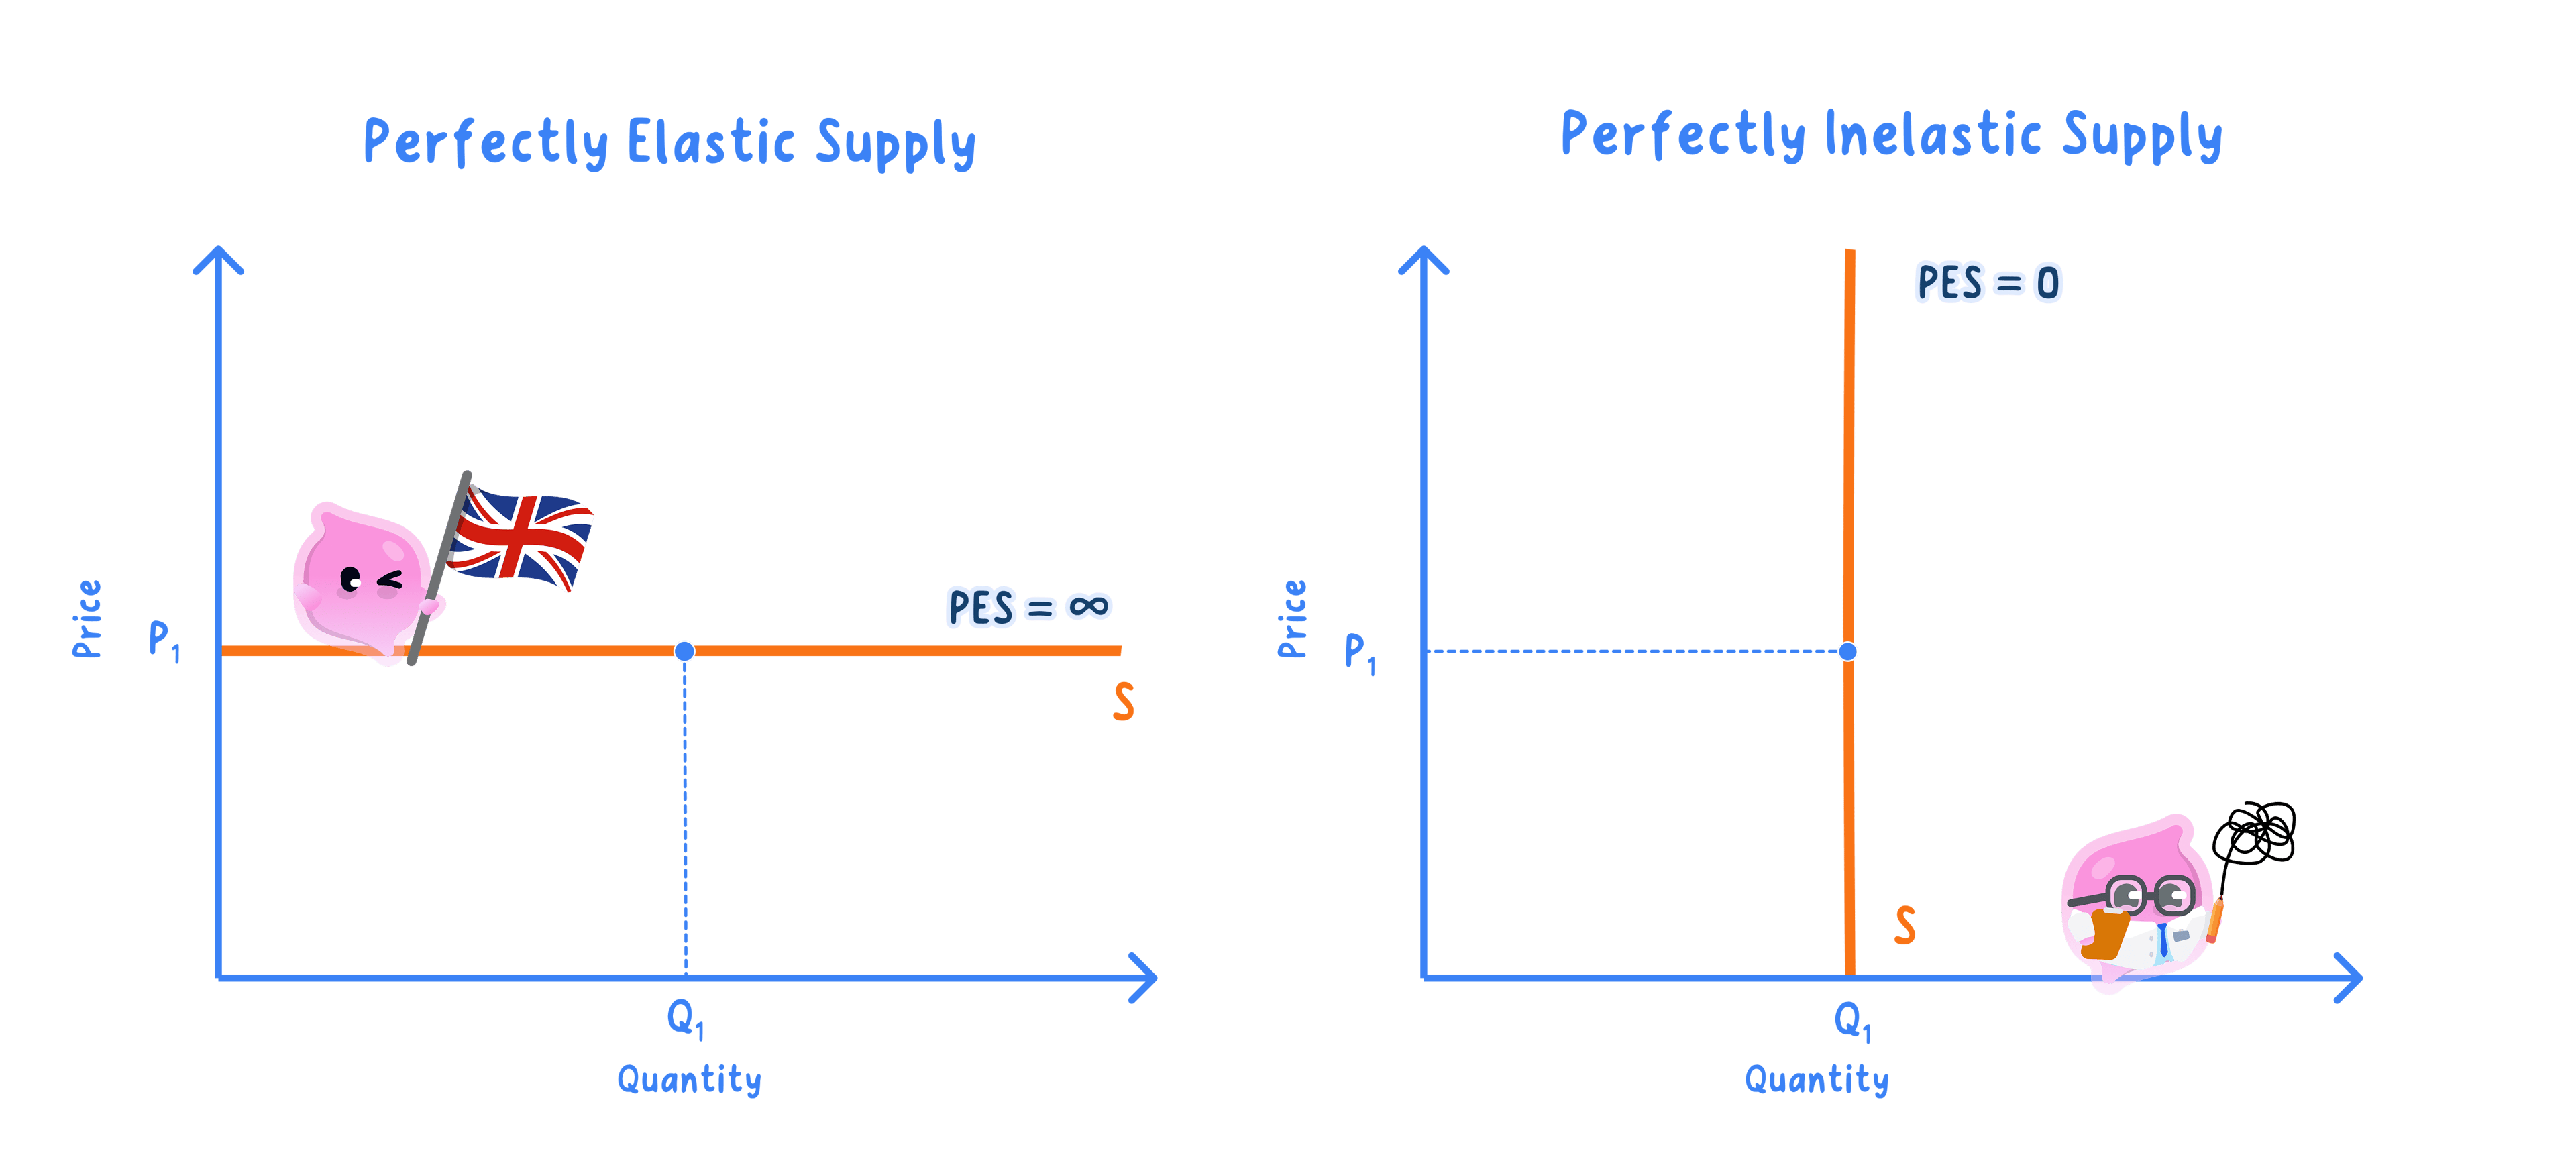
The extremes are vertical and horizontal lines
Definition
Perfectly inelastic supply: supply that does not change at all when price changes, drawn as a vertical line, where PES is 0.
Perfectly elastic supply: supply that firms will offer in any quantity at one price but nothing at all below it, drawn as a horizontal line, where PES is infinite.
- A vertical curve fits a fixed quantity that cannot be added to, such as tickets for a stadium on the night or a painting by an artist who has died.
- A horizontal curve fits a firm that can produce any amount at the same unit cost, so it will supply as much as is wanted at that price.
- Both are limiting cases used to anchor the scale, so real goods sit somewhere between them.
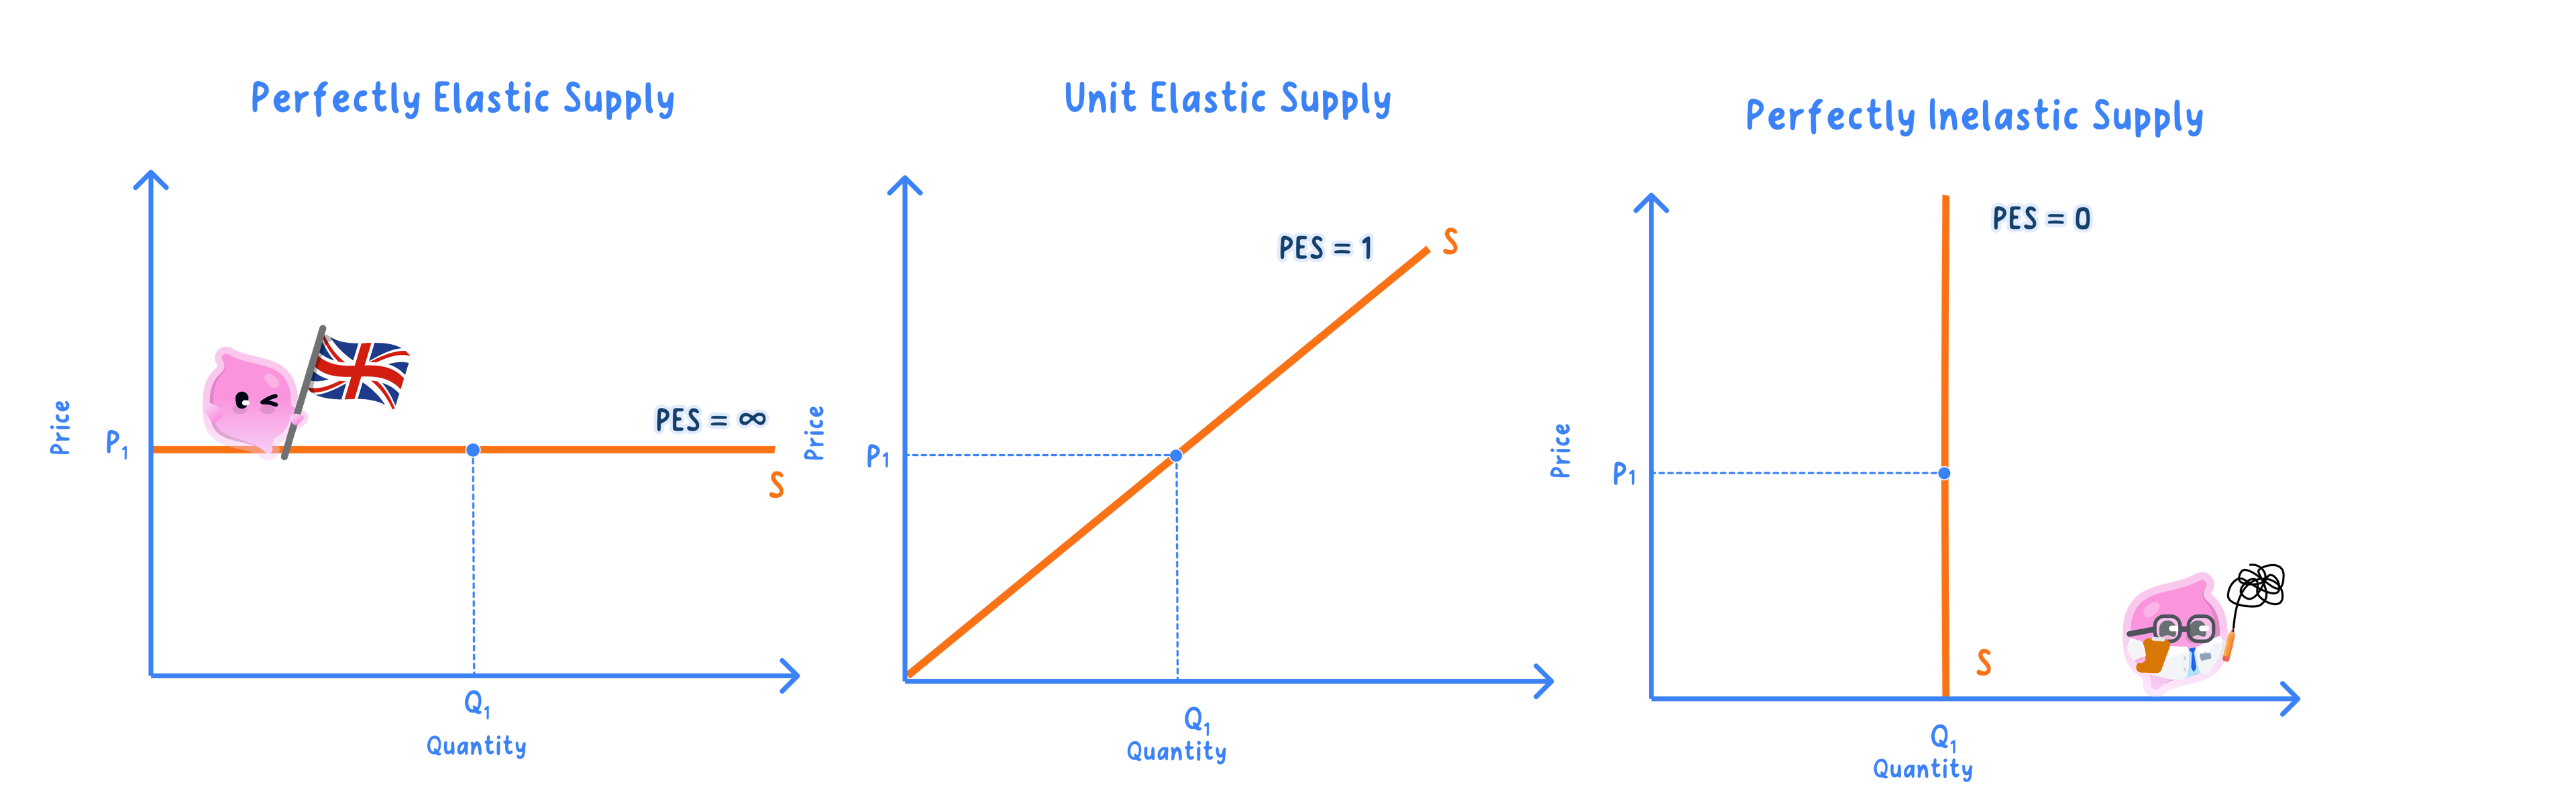
Draw the curve the good actually needs
- Read the good and the time period first, because a crop this season needs a near-vertical curve and a factory with spare capacity needs a shallow one.
- Label the axes and the curve S before drawing anything else, exactly as in 2.3.2.
- Show the price change as a horizontal line across to each curve, then drop down to read the quantities off.
Common Mistake
- Do not draw an inelastic supply curve sloping downwards, since every supply curve rises whatever its elasticity.
- Do not confuse a vertical supply curve with a supply curve that has shifted, because the vertical line is a shape and not a movement.
Two curves on one diagram make the comparison
- Draw both curves through the same starting point, so the comparison begins from one price and one quantity.
- Apply the identical price change to each and label the quantities that result on both.
- The elastic curve gives the wider gap between its two quantities, and saying so in words is what turns the drawing into an answer.
Exam technique
- Use the same price change on both curves when comparing, because different price changes prove nothing about elasticity.
- Name the time period on the diagram when it matters, since a short-run and a long-run supply curve for the same good look quite different.
Self review
- Is a steep supply curve elastic or inelastic?
- How is perfectly inelastic supply drawn?
- What kind of good has a vertical supply curve?
- What PES value does a vertical supply curve have?
- Why must the same price change be used on both curves when comparing them?
