Work through a change one step at a time
- Name which curve moves, because a change either alters buying plans or selling plans and almost never both.
- Say which way it moves and why, using the causes in 2.2.5 for demand and 2.3.5 for supply.
- Read the new crossing point, then state what happened to price and to quantity separately.
- Finish by naming who gains and who loses, since that is what turns a description of the diagram into analysis.
A related market's change arrives as a shift
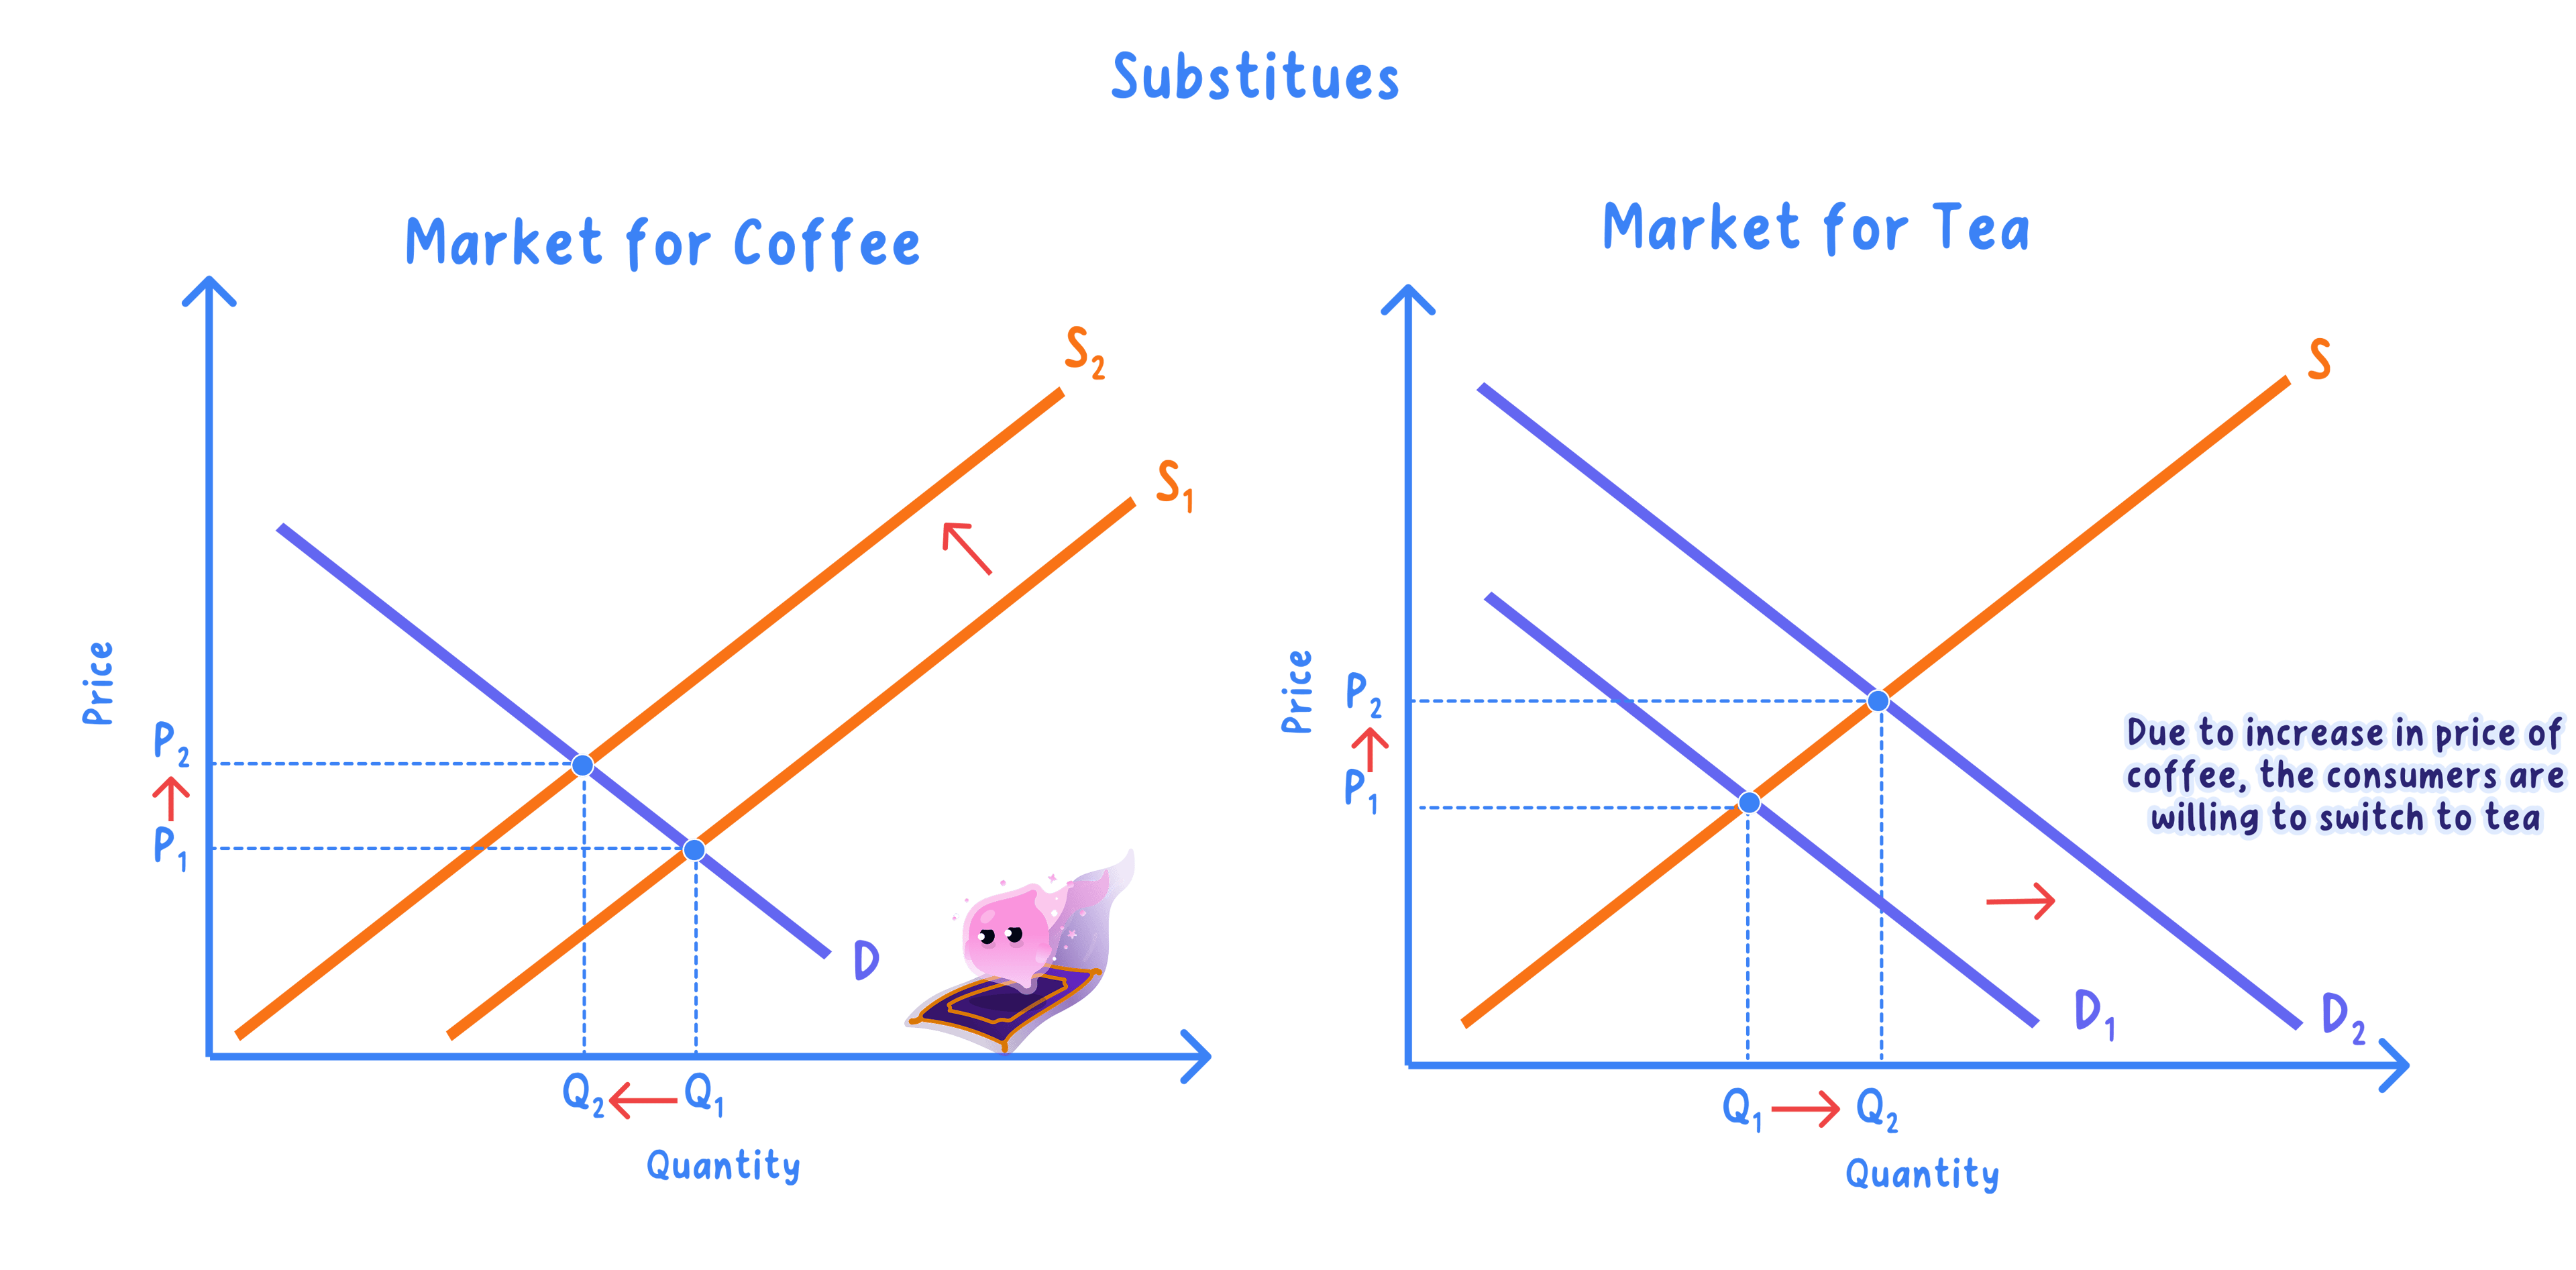
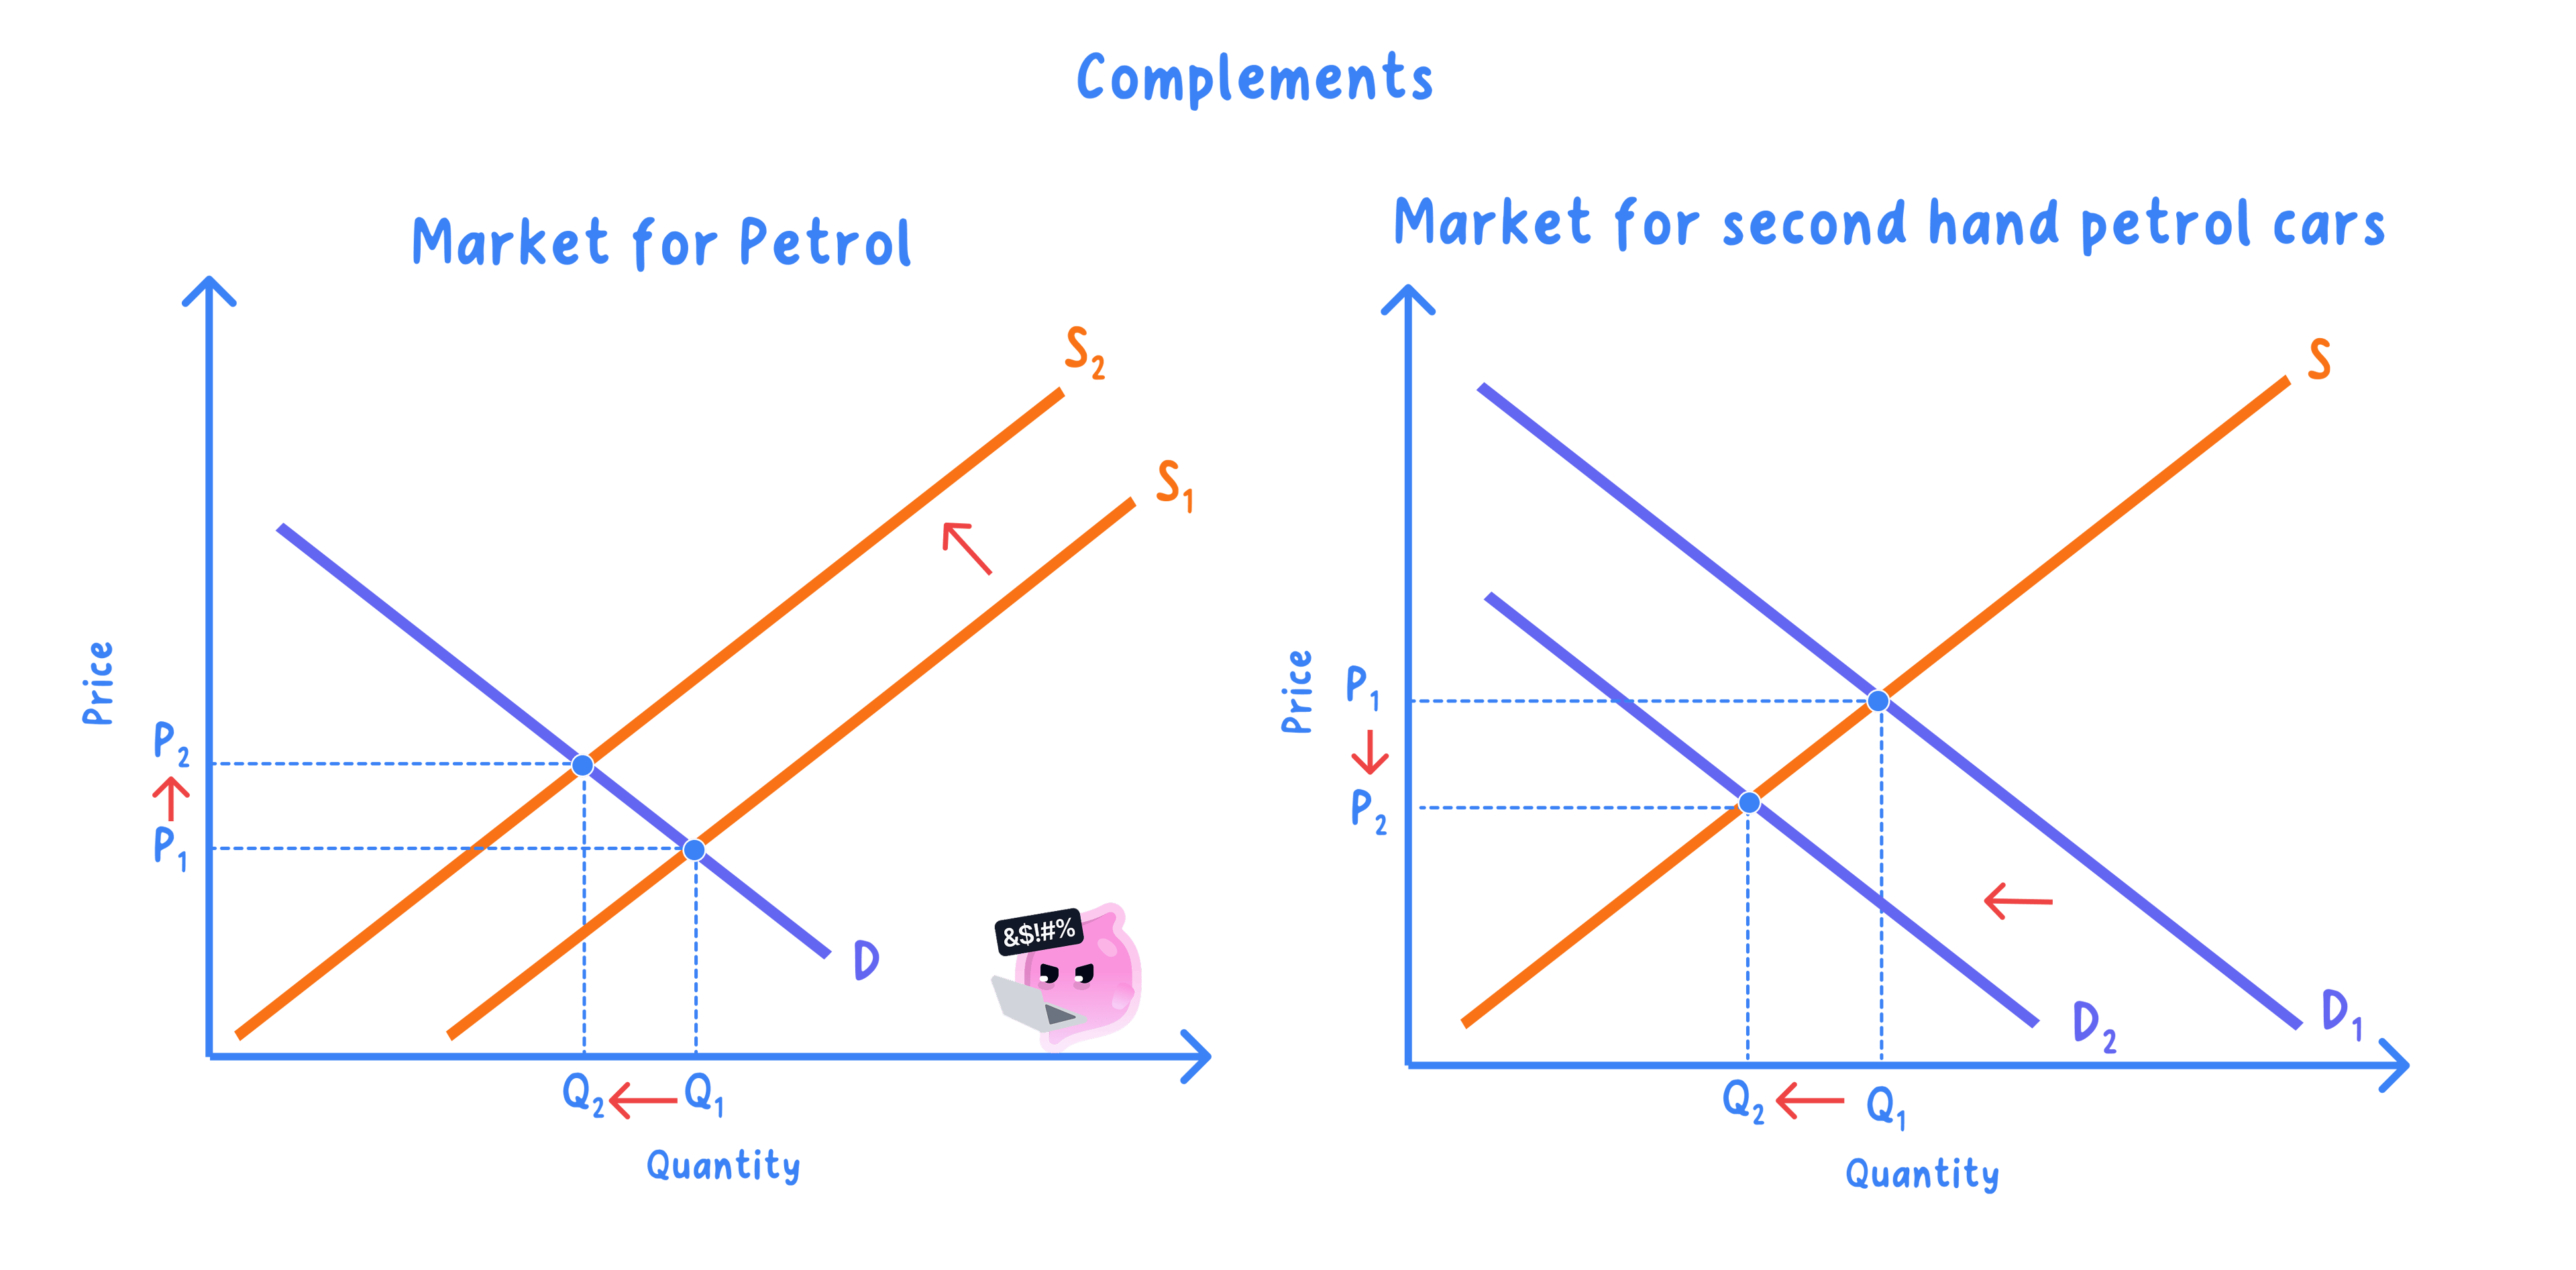
- The price of a substitute or a complement is not the price of the good being studied, so it shifts this market's demand curve.
- A rise in a substitute's price sends buyers across, so demand here increases and both price and quantity rise.
- A rise in a complement's price does the opposite, because the two are bought together and buyers cut back on the pair.
- This is how a single event reaches markets it never touched directly, which is the interdependence set out in 2.4.5.
Example
- Wholesale gas prices rose about 11% over three months, and Ofgem raised the energy price cap by 4% to £1,723 a year for a typical household from October 2026 (Source: Ofgem).
- Higher energy is a cost to producers, so in the market for a gas-fired good the supply curve shifts left, raising price and cutting quantity.
- In the market for home insulation the same event shifts demand right, because insulation is a substitute for energy and buyers facing dearer gas buy insulation instead of extra heat.

Both curves can move at once
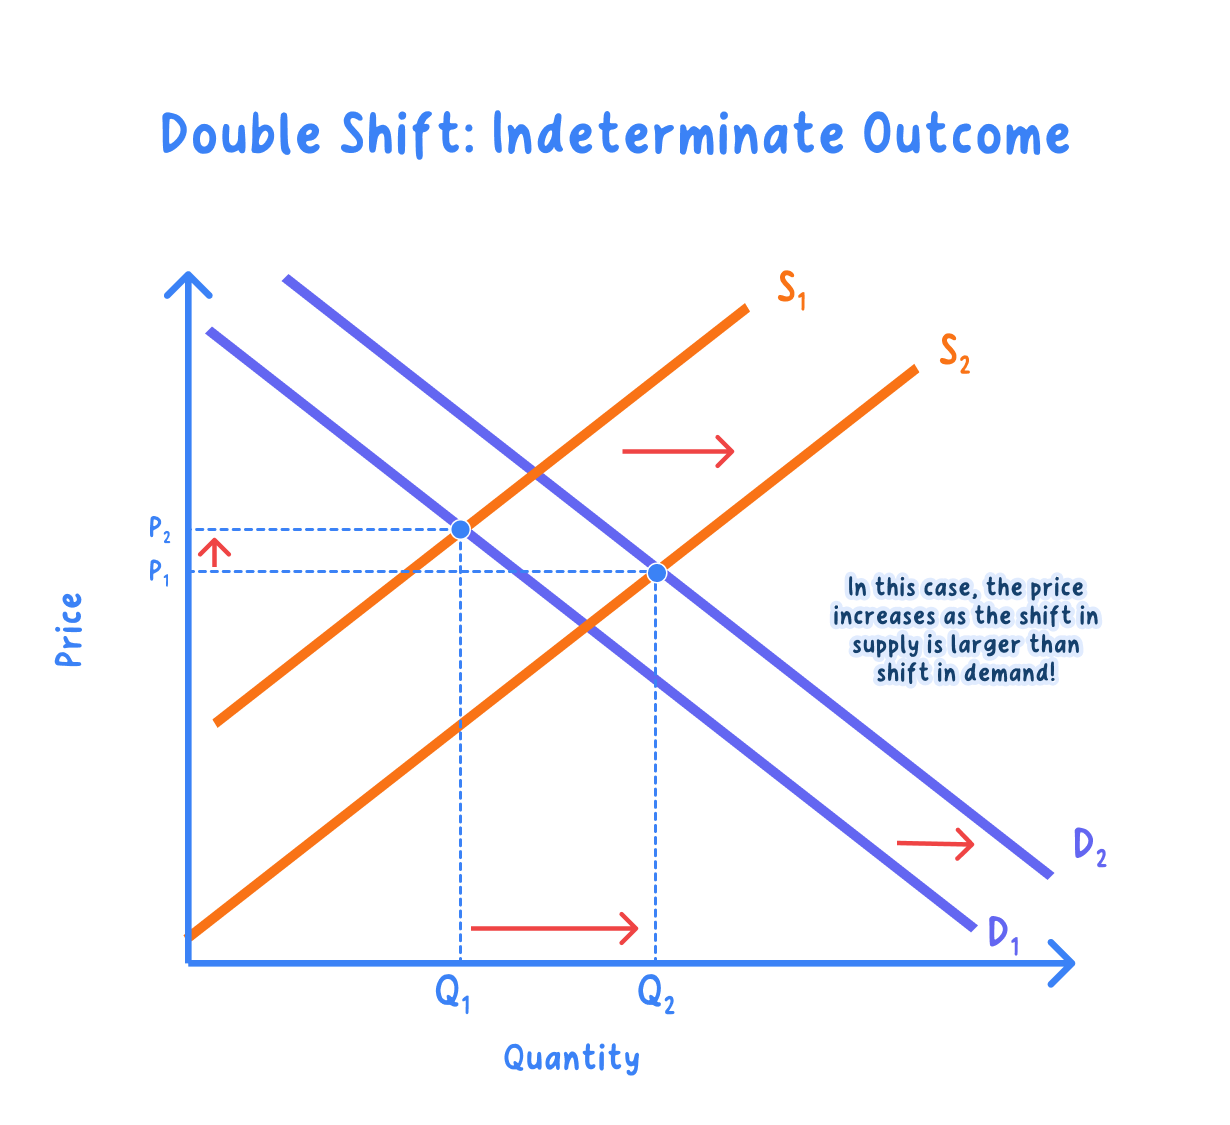
- When demand and supply both shift, one of the two results is certain and the other depends on which shift is larger.
- Demand up and supply up together must raise the quantity, but the price could go either way.
- Demand up and supply down together must raise the price, while the quantity depends on the relative sizes.
- Say which result is certain and which is ambiguous, because claiming certainty about both is the commonest error here.
Common Mistake
- Do not shift both curves unless the question describes two separate changes, since one event usually moves one curve.
- Do not assert a definite answer for the ambiguous variable, because with two shifts its direction genuinely is not determined.
Say what happens to price and to quantity
- Give both outcomes with a direction each, so a supply fall raises price and cuts quantity, not simply changes the market.
- Quote the figures if the question gives them, and use the labels from your own diagram if it does not.
- Name the effect on the two groups the specification cares about, so say what consumers pay and what producers sell.
Exam technique
- Build the chain in order, from the cause to the curve to the new equilibrium to the effect on people, since a missing link is where the marks go.
- Say which of the two results is uncertain when both curves move, because recognising that is worth more than guessing.
Self review
- What are the four steps in analysing a change in a market?
- The price of a substitute rises. What happens in this market?
- Why does dearer energy raise the price of a gas-fired good?
- Demand rises and supply rises. Which result is certain and which is not?
- Why is it wrong to shift both curves for a single event?
