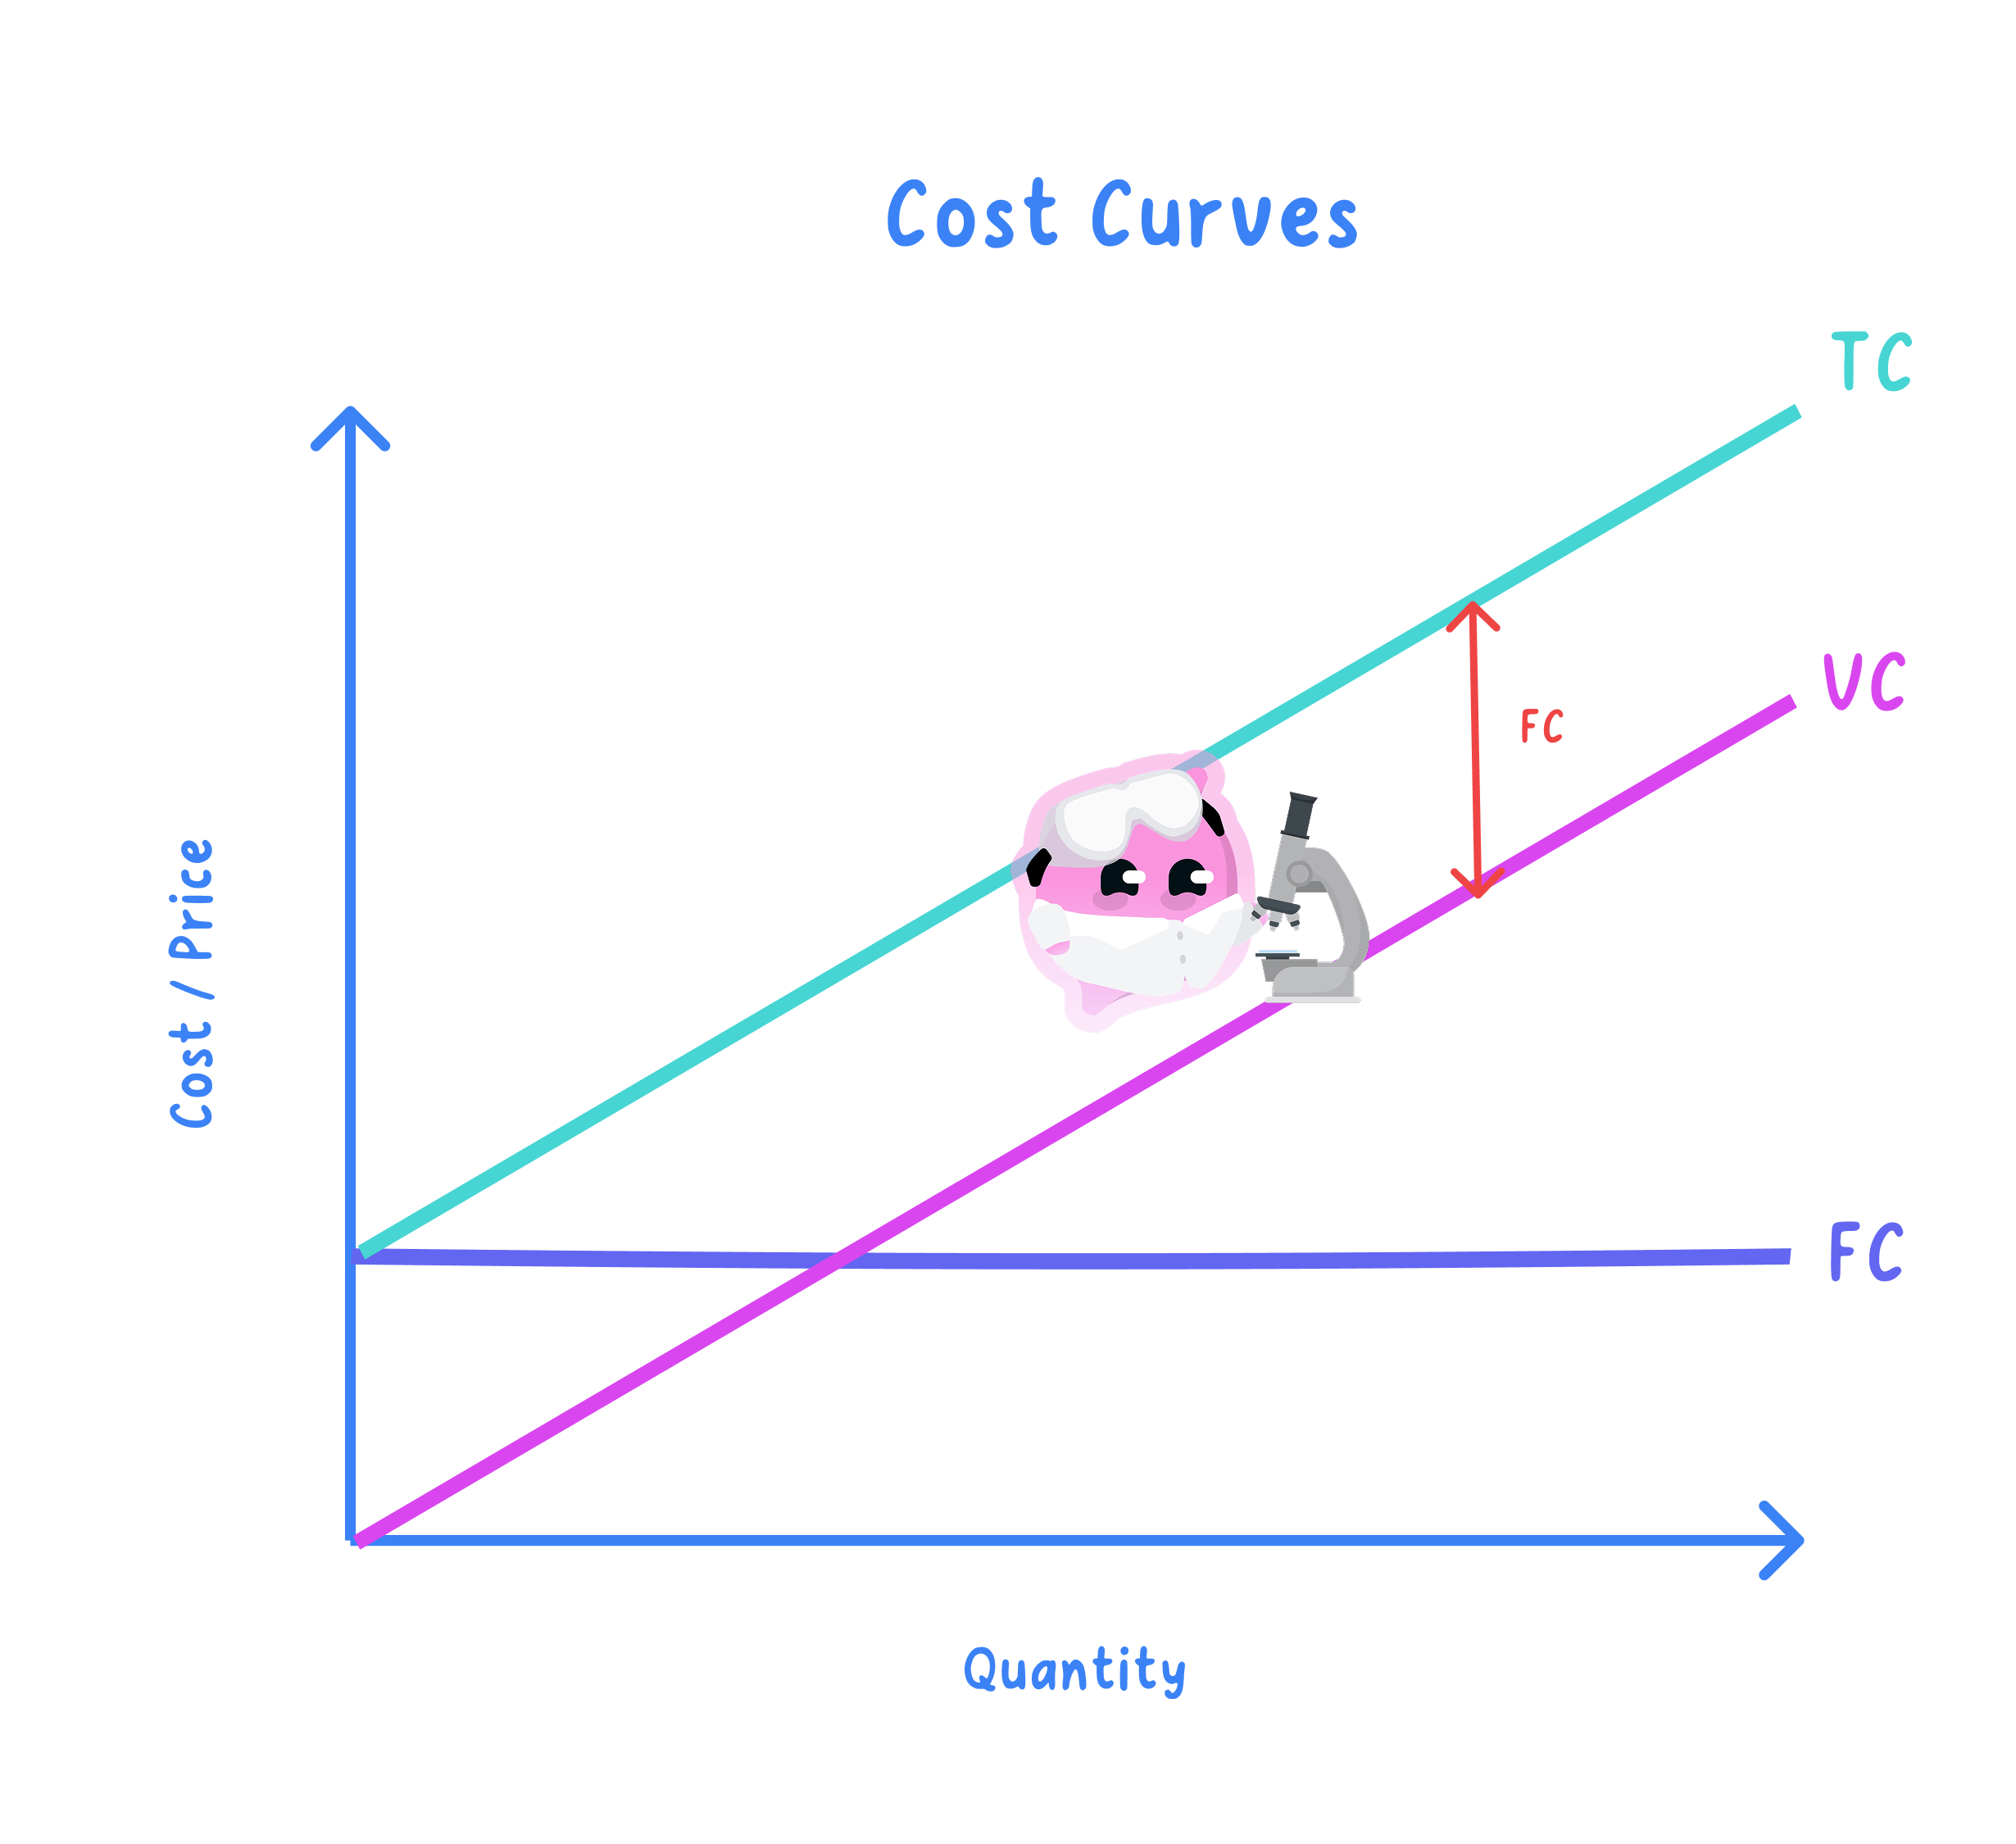
Fixed costs stay constant; variable costs rise with output
Fixed costs: the costs that stay the same however much the firm produces, such as rent, business rates and insurance.
Variable costs: the costs that rise and fall with output, such as ingredients, packaging and the wages of staff paid by the hour.
- Fixed costs are fixed in total and not per unit, so the same £600 of weekly rent is 60p on each of 1,000 items and 15p on each of 4,000.
- Which of the two a cost belongs to depends on the time period, since that shop cannot walk away from its lease this month but can choose not to renew it in three years.
- Keep the periods matching too, so weekly fixed costs go with weekly output, or the average means nothing.
Add costs for total, divide for average
Total cost: the fixed costs and the variable costs added together at a given level of output.
Average cost: the total cost of an output divided by the number of units produced, which is what one unit costs on average.
- A variable cost is nearly always handed to you per unit, so turn it into a total first: variable cost=cost per unit×output\text{variable cost} = \text{cost per unit} \times \text{output}variable cost=cost per unit×output.
- The other two lines then follow:
One bakery's costs, worked at one output
- A high street bakery has fixed costs of £600 a week covering its rent, business rates, insurance and the lease on its oven.
- Each sausage roll it bakes adds 40p of variable cost in pastry, filling, packaging and staff hours.
- Work one output level right through before touching the others, because the same three lines then repeat at every level.
- Three thousand rolls a week: fixed costs are £600 and the variable cost is 40p on each of the 3,000 rolls.
- So a roll costs the bakery 60p to make at that output, and the same three lines fill in every other row of the table.
| Rolls a week | Fixed cost | Variable cost | Total cost | Average cost |
|---|---|---|---|---|
| 1,000 | £600 | £400 | £1,000 | £1.00 |
| 2,000 | £600 | £800 | £1,400 | £0.70 |
| 3,000 | £600 | £1,200 | £1,800 | £0.60 |
| 4,000 | £600 | £1,600 | £2,200 | £0.55 |
Average cost falls as fixed costs spread thinner
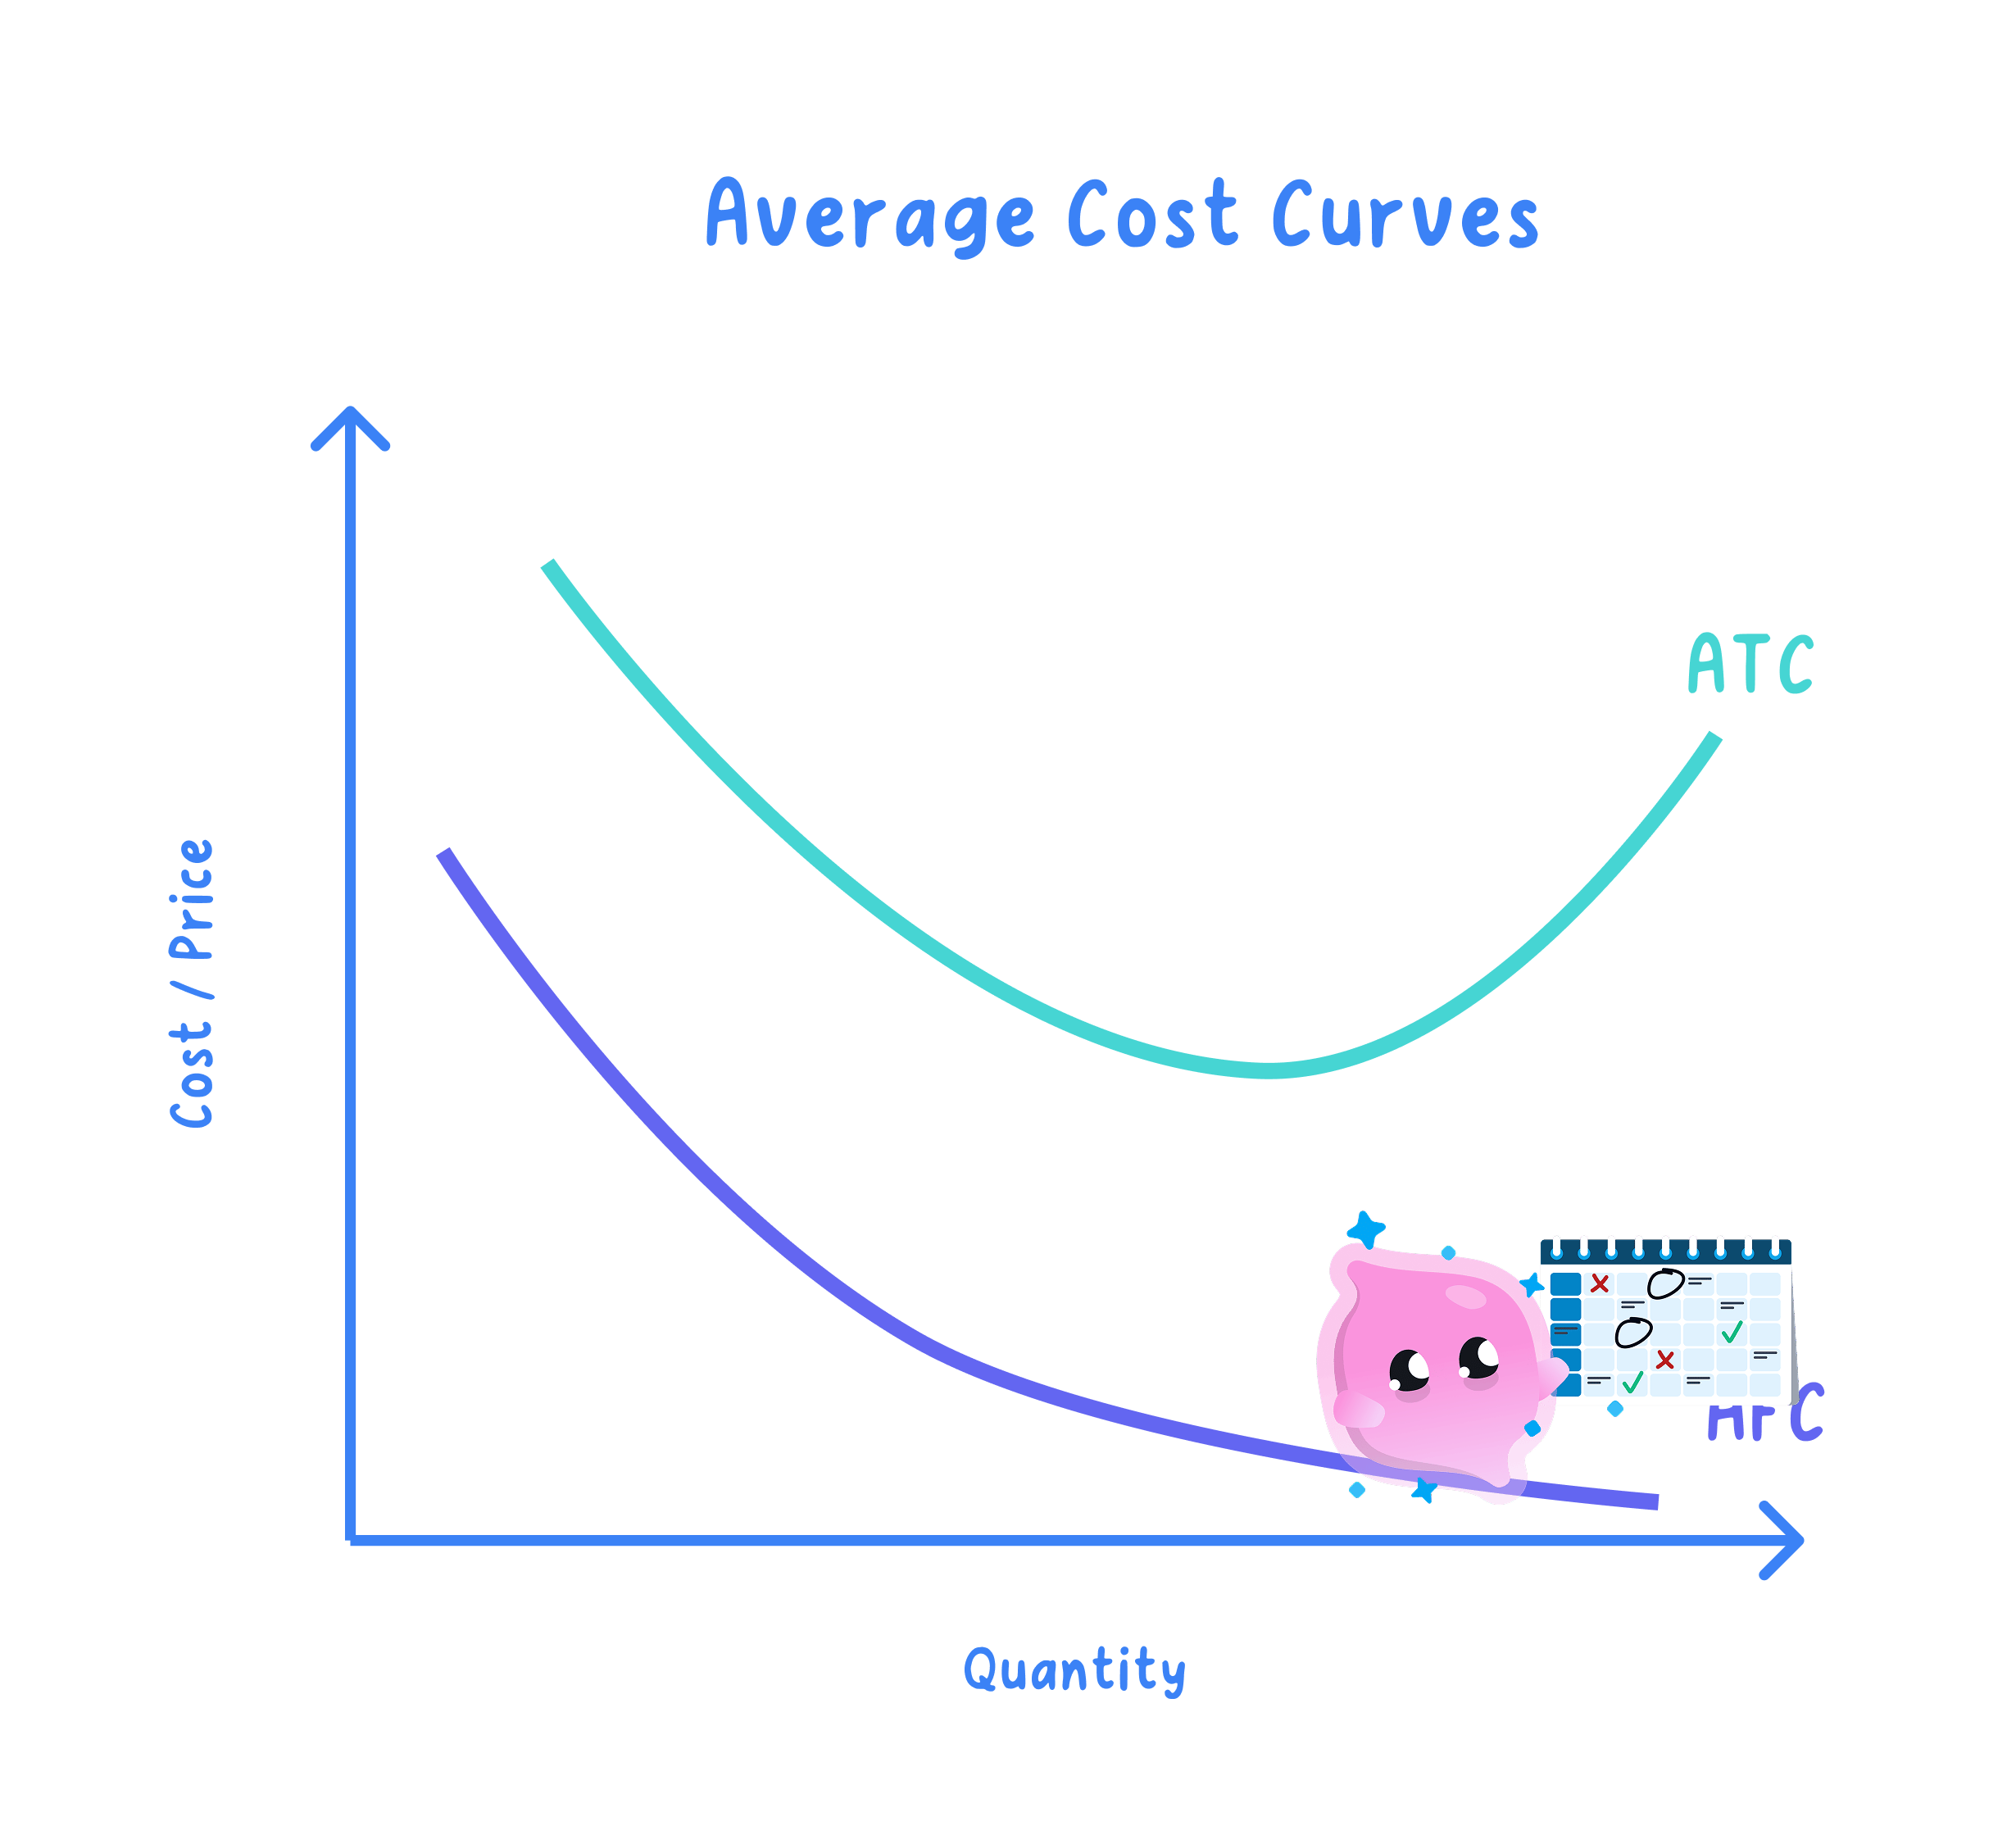
- The £600 is spread over more rolls at every step, so the fixed cost carried by each roll falls from 60p at 1,000 rolls to 15p at 4,000.
- The variable cost carried by each roll stays at 40p throughout, because every extra roll needs the same pastry and filling as the one before it.
- Average cost is those two figures added, which is why it falls from £1.00 to 55p while total cost climbs from £1,000 to £2,200.
- The bakery is spending more money in total and less money on each roll, and those are two different quantities.
- Each fall is smaller than the one before, since sharing £600 over 3,000 rolls rather than 2,000 saves 10p a roll while sharing it over 4,000 rather than 3,000 saves only 5p, so a drawn average cost curve slopes down and flattens as it goes.
- Average cost stops falling once the bakery has to pay overtime or fire up a second oven, because the variable cost on each roll then starts to climb.
Multiply price by quantity for total revenue
Total revenue: all the money a firm receives from selling its output over a period, before any costs are taken off.
Average revenue: total revenue divided by the quantity sold, which is what one unit brought in on average.
- The two lines of arithmetic are these:
- Average revenue equals the price whenever every unit sells at the same price, so a question can hand you the price and expect average revenue back with no working at all.
- It drops below the shelf price as soon as some units go at a discount, so an end of day price cut pulls the average down without the shelf price changing at all.
- Multiply price by quantity and never add them, since £1.20 and 3,000 rolls are measured in different units.
A falling price makes total revenue rise then fall
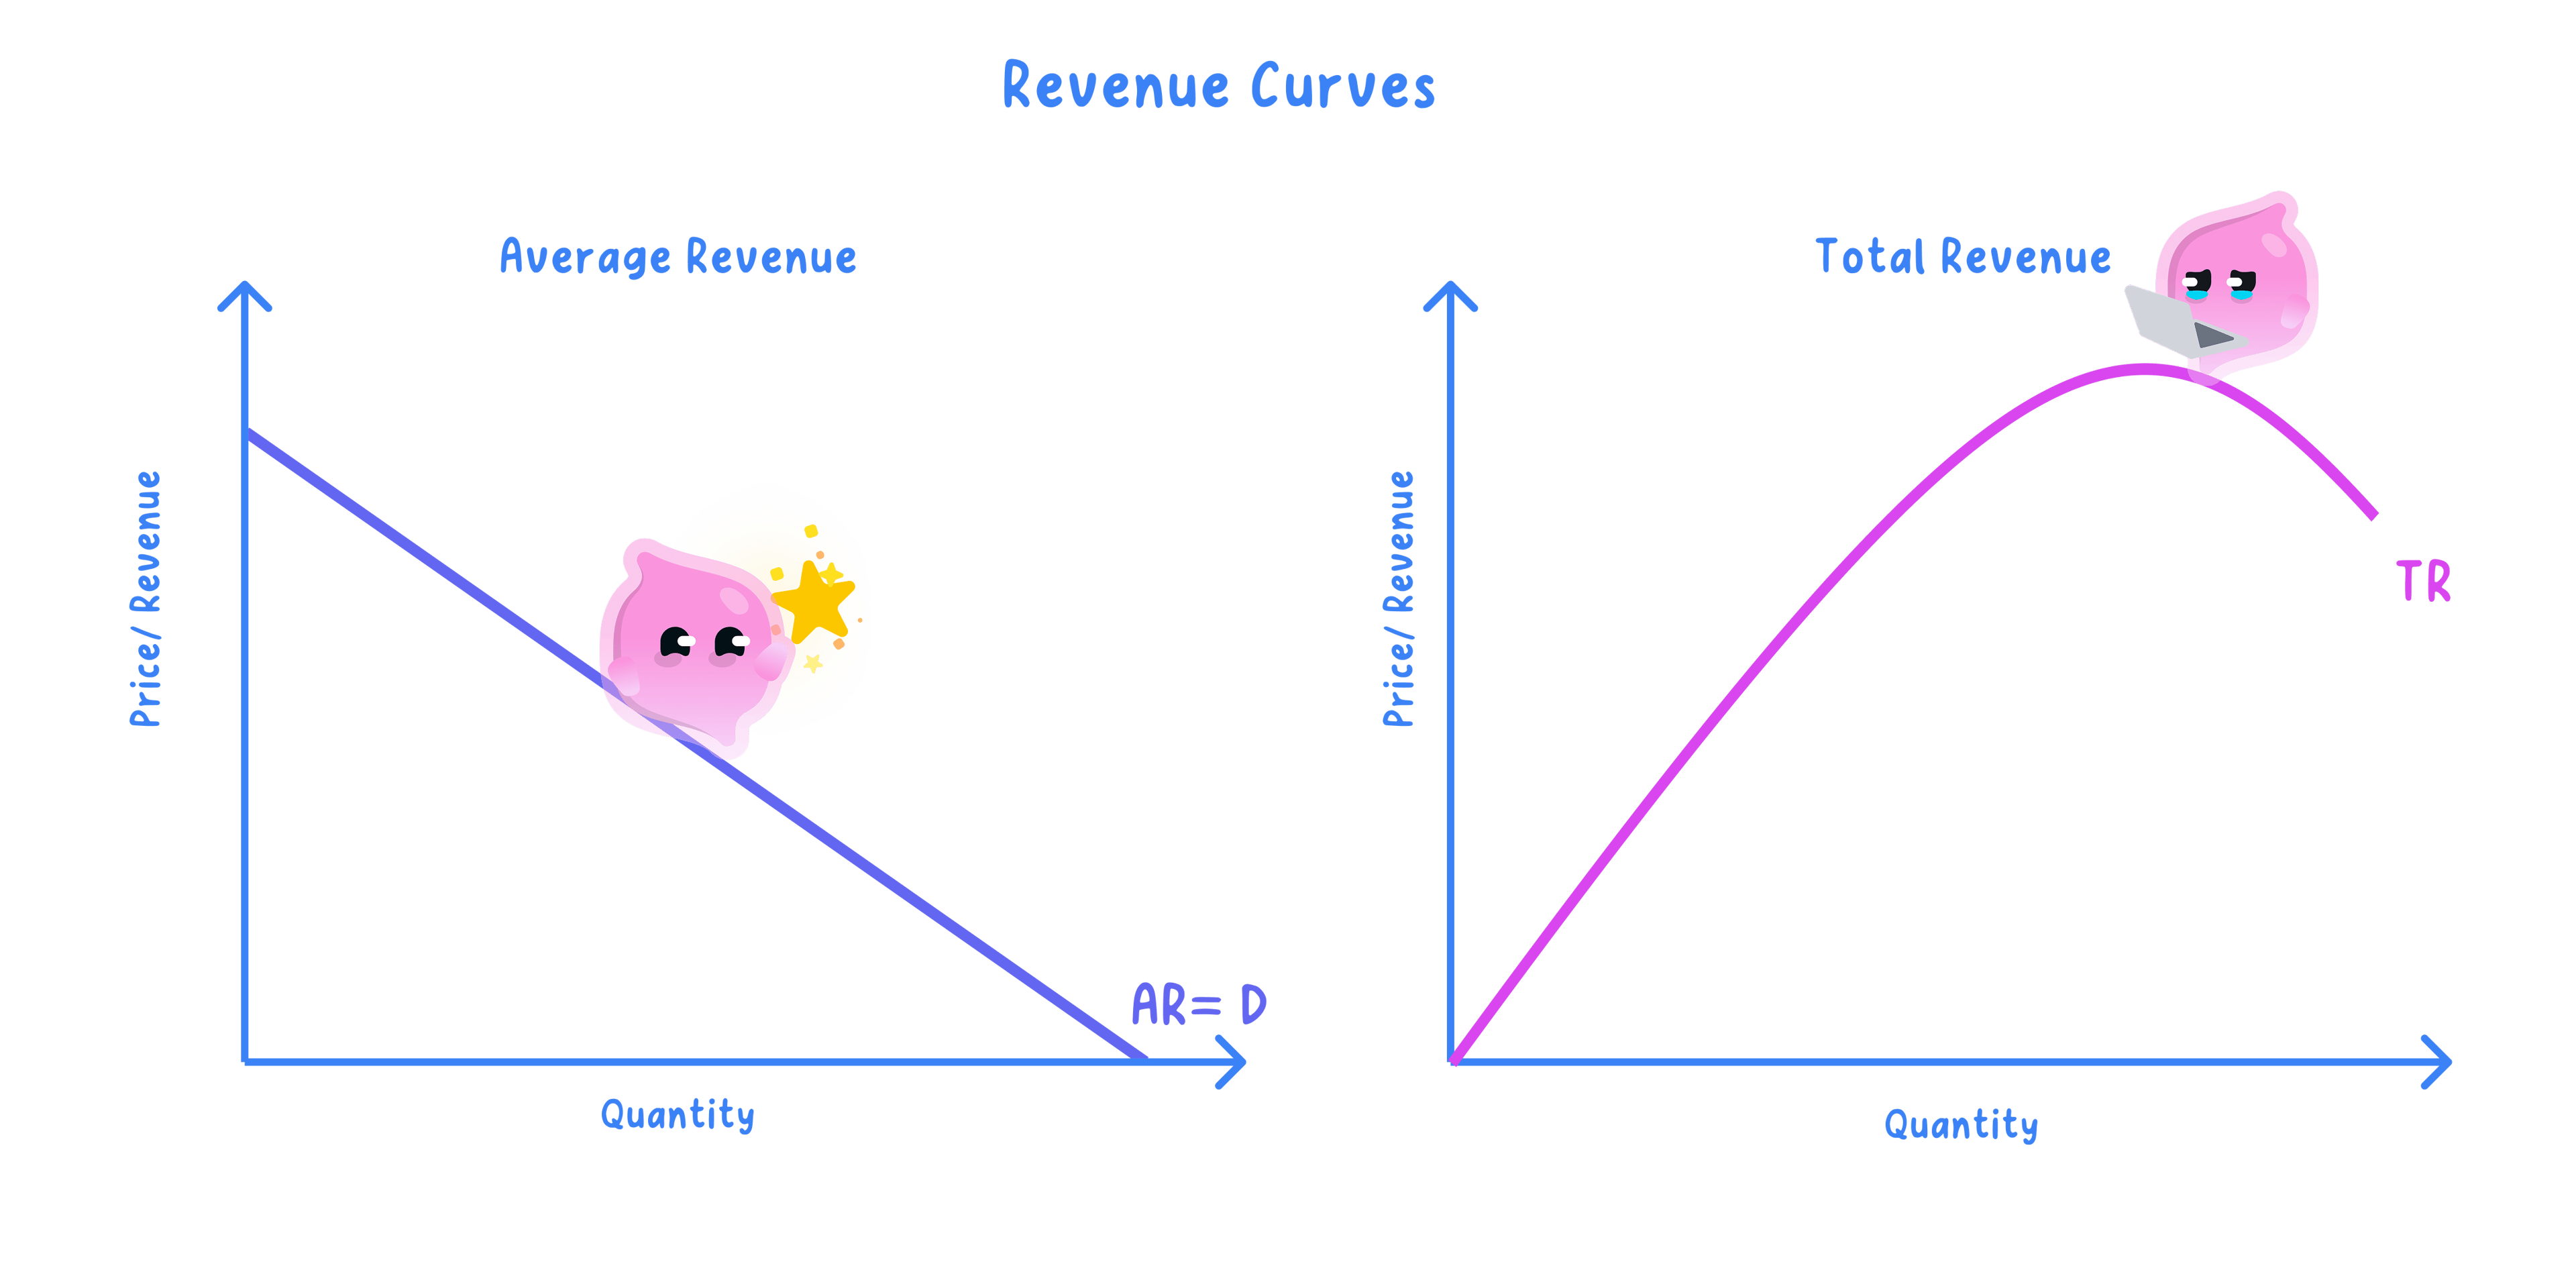
- When every unit sells at the same price, average revenue stays equal to that price and total revenue rises in step with the quantity sold, which is the bakery case the article's own arithmetic uses.
- When a firm has to lower its price to sell more, the price it can charge at each quantity is what demand shows, so its average revenue is the same thing as the demand it faces, which is what "AR = D" means.
- In that second case total revenue rises at first, reaches a peak and then falls. The reason is price elasticity of demand, which is covered in 1.3.5c: while demand is price elastic the extra units sold outweigh the lower price and revenue rises; once demand is price inelastic the price cut costs more than the extra units bring in, so revenue falls.
- The peak is where those two effects balance.
What is left once total costs are taken off total revenue is section 1.4.1c.
- Revenue is not profit, because nothing has yet been taken off for the pastry, the rent or the staff.
- Divide by output for an average cost and by quantity for an average revenue, never by the price.
- Do not multiply a fixed cost by output, because the figure you are given is already the total.
The same bakery's revenue, at one price then two
- The bakery sells its rolls at £1.20 and, at the output levels in the cost table, sells everything it bakes.
- The second scenario is a week when it clears the last 1,000 rolls at a 60p end of day price, which is where average revenue parts company with the shelf price.
- Three thousand rolls, all at £1.20: the same price is charged on every roll sold.
- Average revenue has come back as the price, exactly as it must when every unit sells for the same amount.
| Rolls sold | Price | Total revenue | Average revenue |
|---|---|---|---|
| 1,000 | £1.20 | £1,200 | £1.20 |
| 2,000 | £1.20 | £2,400 | £1.20 |
| 3,000 | £1.20 | £3,600 | £1.20 |
| 4,000 | £1.20 | £4,800 | £1.20 |
- The same week, clearing the last 1,000 rolls at 60p: it bakes 4,000 rolls in total, selling 3,000 at the full £1.20 price and discounting the final 1,000.
- Average revenue of £1.05 sits below the £1.20 shelf price, which is exactly what a discount on some units does to the average.
Work forward from whichever figure you are given
- Given fixed cost and variable cost, add them for total cost and then divide by output for average cost.
- Given total cost and output only, divide for average cost and do not try to split the total back into its fixed and variable parts.
- Given average cost and output, multiply to recover the total: total cost=average cost×output\text{total cost} = \text{average cost} \times \text{output}total cost=average cost×output.
- Given total revenue and quantity, divide for average revenue, and given the price instead, average revenue is that price already.
- Check the revenue side by multiplying average revenue back by quantity, which should return total revenue.
- Turn a per-unit variable cost into a total (multiply by output) before adding the fixed cost.
- Fill a table's total columns before its average columns, since every average needs its total.
- Check an average cost by adding fixed cost per unit to variable cost per unit.
- State the formulae for total cost, average cost, total revenue and average revenue.
- Fixed costs are £600 a week and the variable cost is 40p a roll: what are total cost and average cost at 2,000 rolls?
- Why does average cost fall as output rises even though total cost is going up?
- A stall sells 4,000 rolls at £1.20 each: what are its total revenue and its average revenue?
- Total revenue is £3,000 from 3,000 rolls: what is average revenue, and why need it not equal the shelf price?