Plot production data to get the curve
Supply schedule: a table of prices with the quantity a firm would offer for sale at each of those prices.
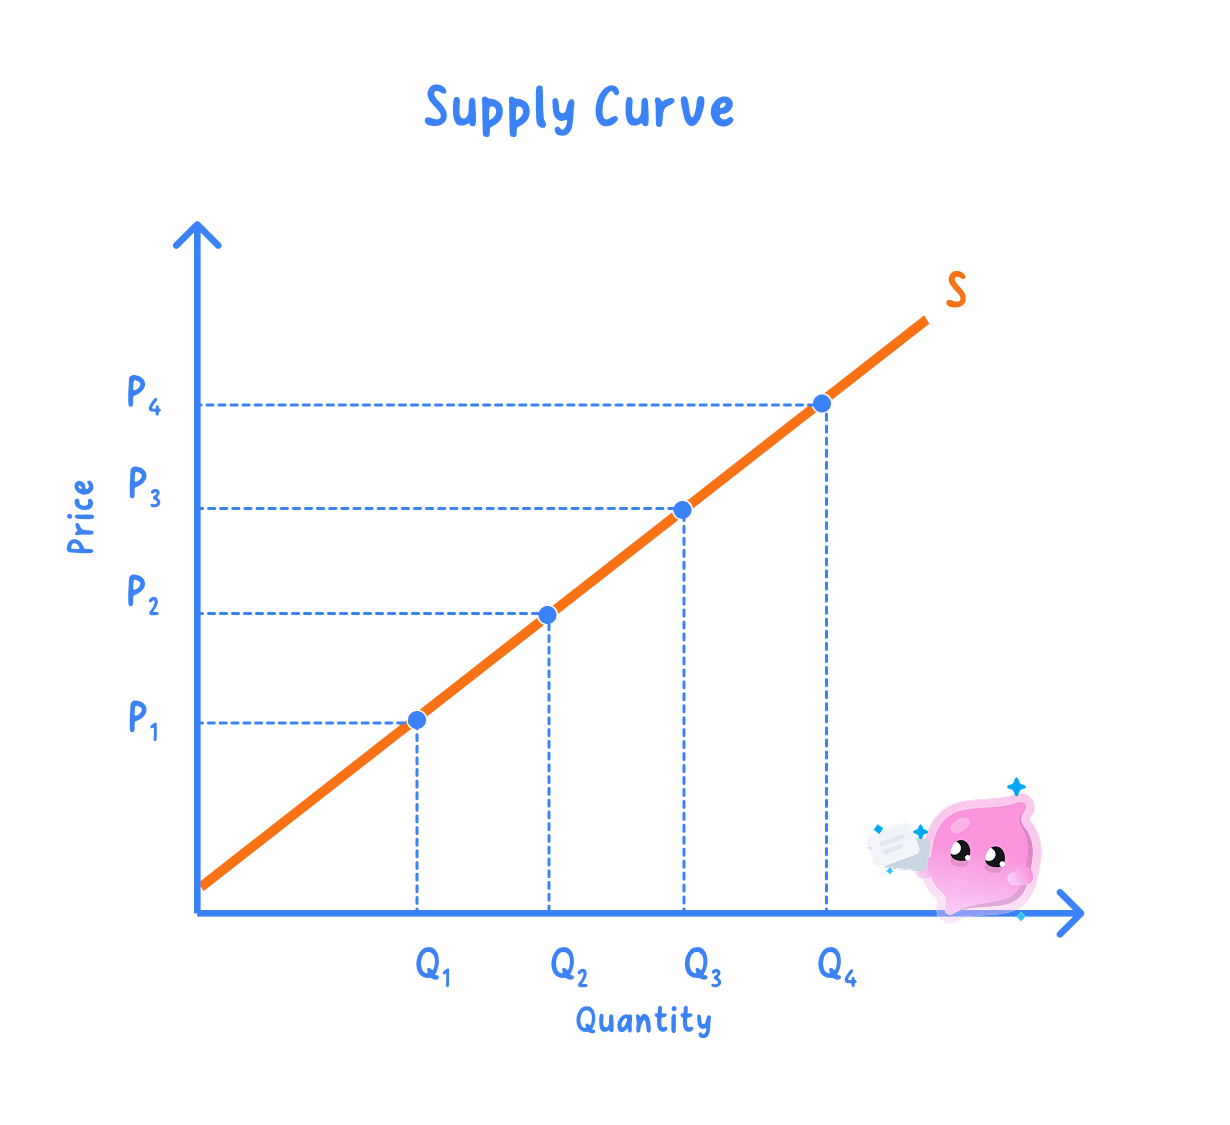
Supply curve: the same information drawn as a line, with each row of the schedule plotted as one point and the line labelled S.
Supply itself, and the non-price factors that change it, are set out in section 1.3.2a.
- Price goes on the vertical axis and quantity supplied on the horizontal axis, exactly as on a demand diagram.
- Plot each row as one point, join them into a single line rising from bottom left to top right, and label it S.
- One firm's line is an individual supply curve, and adding what every firm would offer at each price gives the market curve, with the same upward slope.
- The finished curve holds ceteris paribus, so costs, technology, taxes and the weather are frozen while price alone changes.
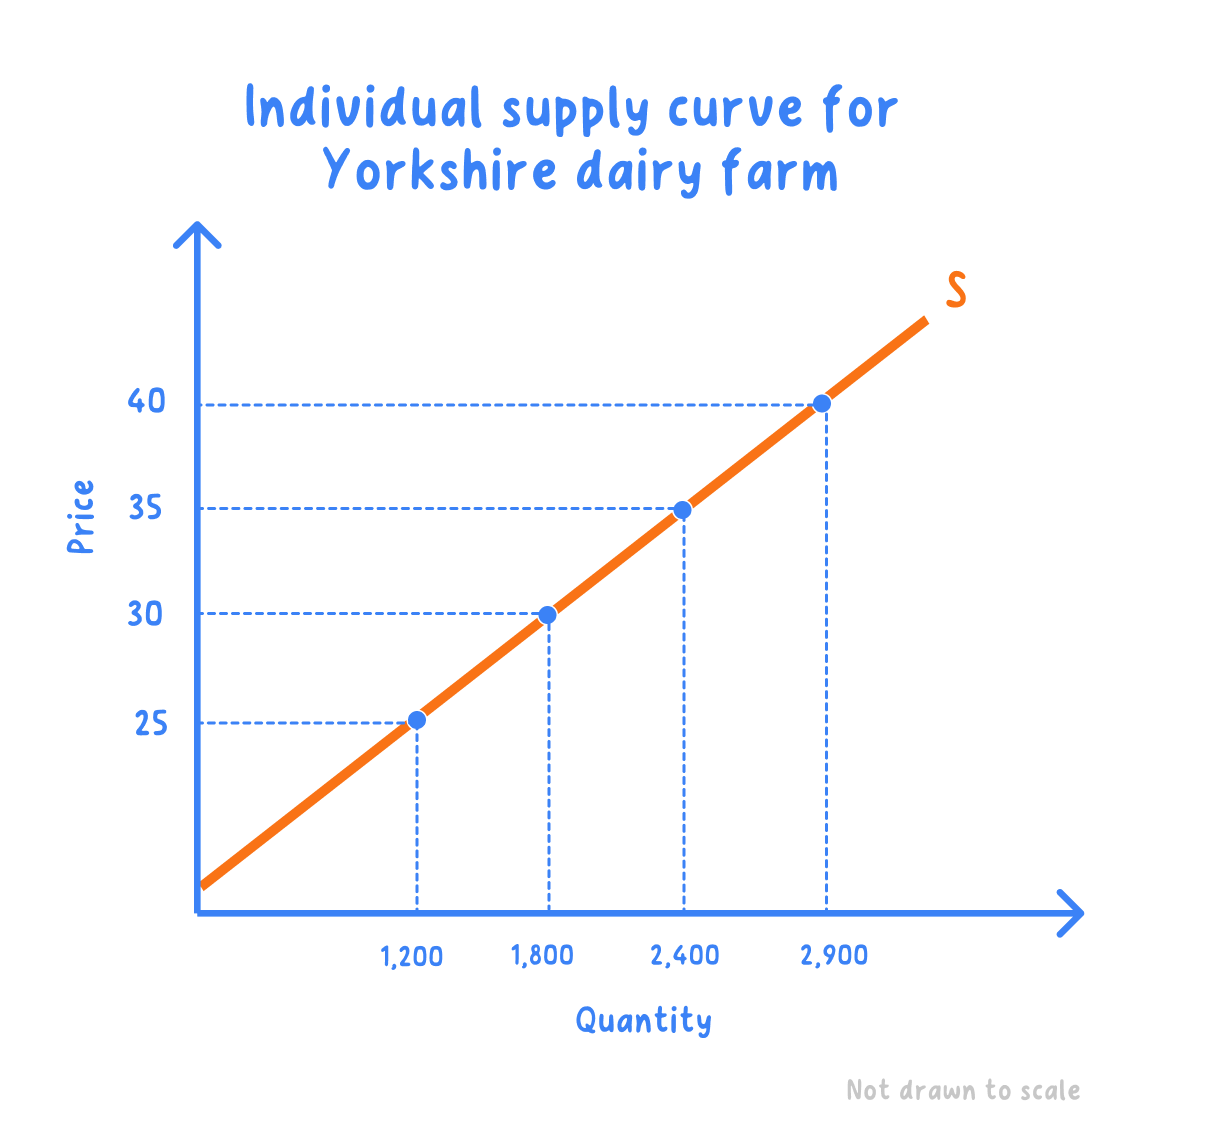
- A Yorkshire dairy farm: the schedule shows the litres of milk a day the farm would sell at each farmgate price.
| Price per litre | Litres a day |
|---|---|
| 25p | 1,200 |
| 30p | 1,800 |
| 35p | 2,400 |
| 40p | 2,900 |
Step 1: plot 25p against 1,200 litres, 30p against 1,800, 35p against 2,400 and 40p against 2,900, then join the points and label the line S.
Step 2: subtract the quantity at the cheapest price from the quantity at the dearest.
2,900−1,200=1,700 litres a day 2{,}900 - 1{,}200 = 1{,}700\text{ litres a day} 2,900−1,200=1,700 litres a day- A rise from 25p to 40p a litre raises quantity supplied by 1,700 litres a day, and all four points sit on the one curve S.
Why the supply curve slopes upwards
- A higher price raises the profit made on each unit sold, so the firm is willing to produce more of them.
- Squeezing out extra output usually costs more per unit, through overtime pay or older machinery, and only a higher price covers that.
- A low price leaves the dearest units unprofitable, so the firm cuts back to the output it can still make at a profit.
- Price and quantity supplied therefore move in the same direction, a direct relationship drawn as the upward slope.
- Never draw a supply curve sloping downwards: a lower price brings less output, not more.
- A rise in the good's own price is an extension of supply, not an increase in supply.
A price change slides you along S
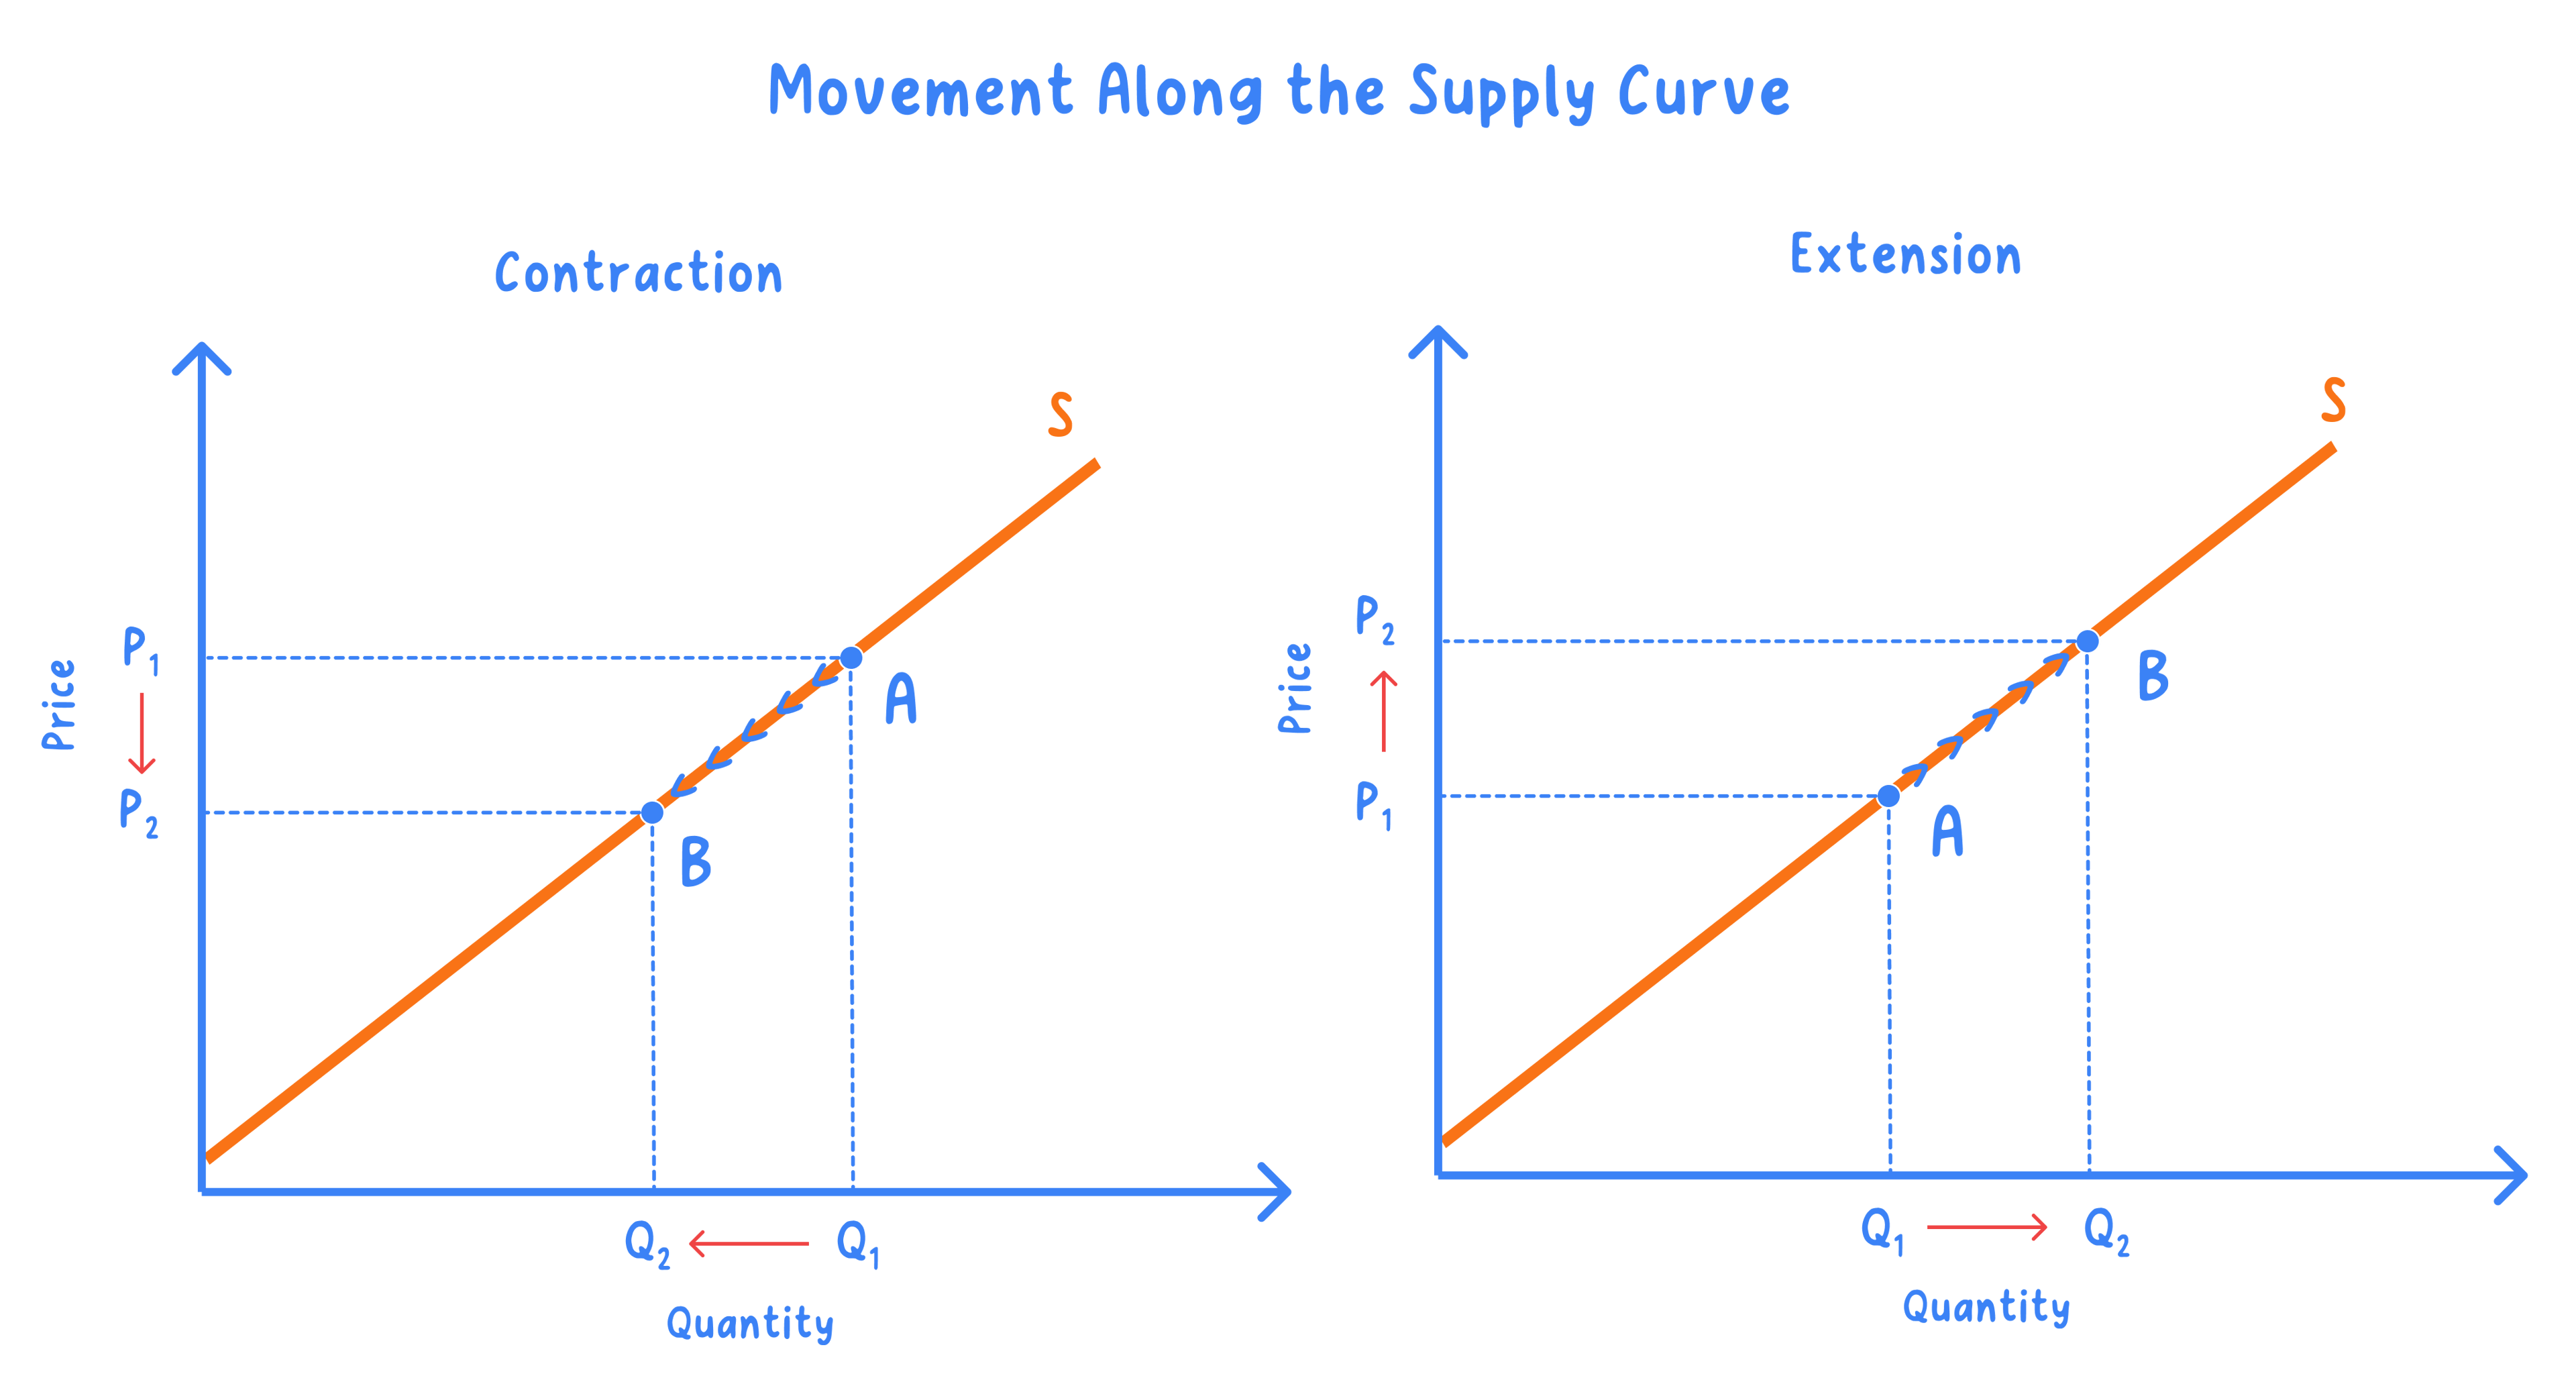
Movement along the supply curve: a change from one point on the curve to another point on the same curve, caused only by a change in the good's own price.
Extension of supply: a rise in quantity supplied after a rise in the good's own price, shown by sliding up the curve to the right.
Contraction of supply: a fall in quantity supplied after a fall in the good's own price, shown by sliding down the curve to the left.
- The curve stays where it was drawn and the label S does not change; what moves is the point being read.
- Mark the two points A and B, and label P1, P2, Q1 and Q2 so the coordinates the firm moved between are visible.
- How far the point slides depends on how quickly the firm can change output, measured as price elasticity of supply in section 1.3.6a.
- Costs, technology, taxes and the weather are unchanged throughout, so the selling plans behind the curve still apply.
A shift changes supply at every price
- A shift happens only when something other than the good's own price changes, such as costs, technology, a tax, a subsidy or the weather.
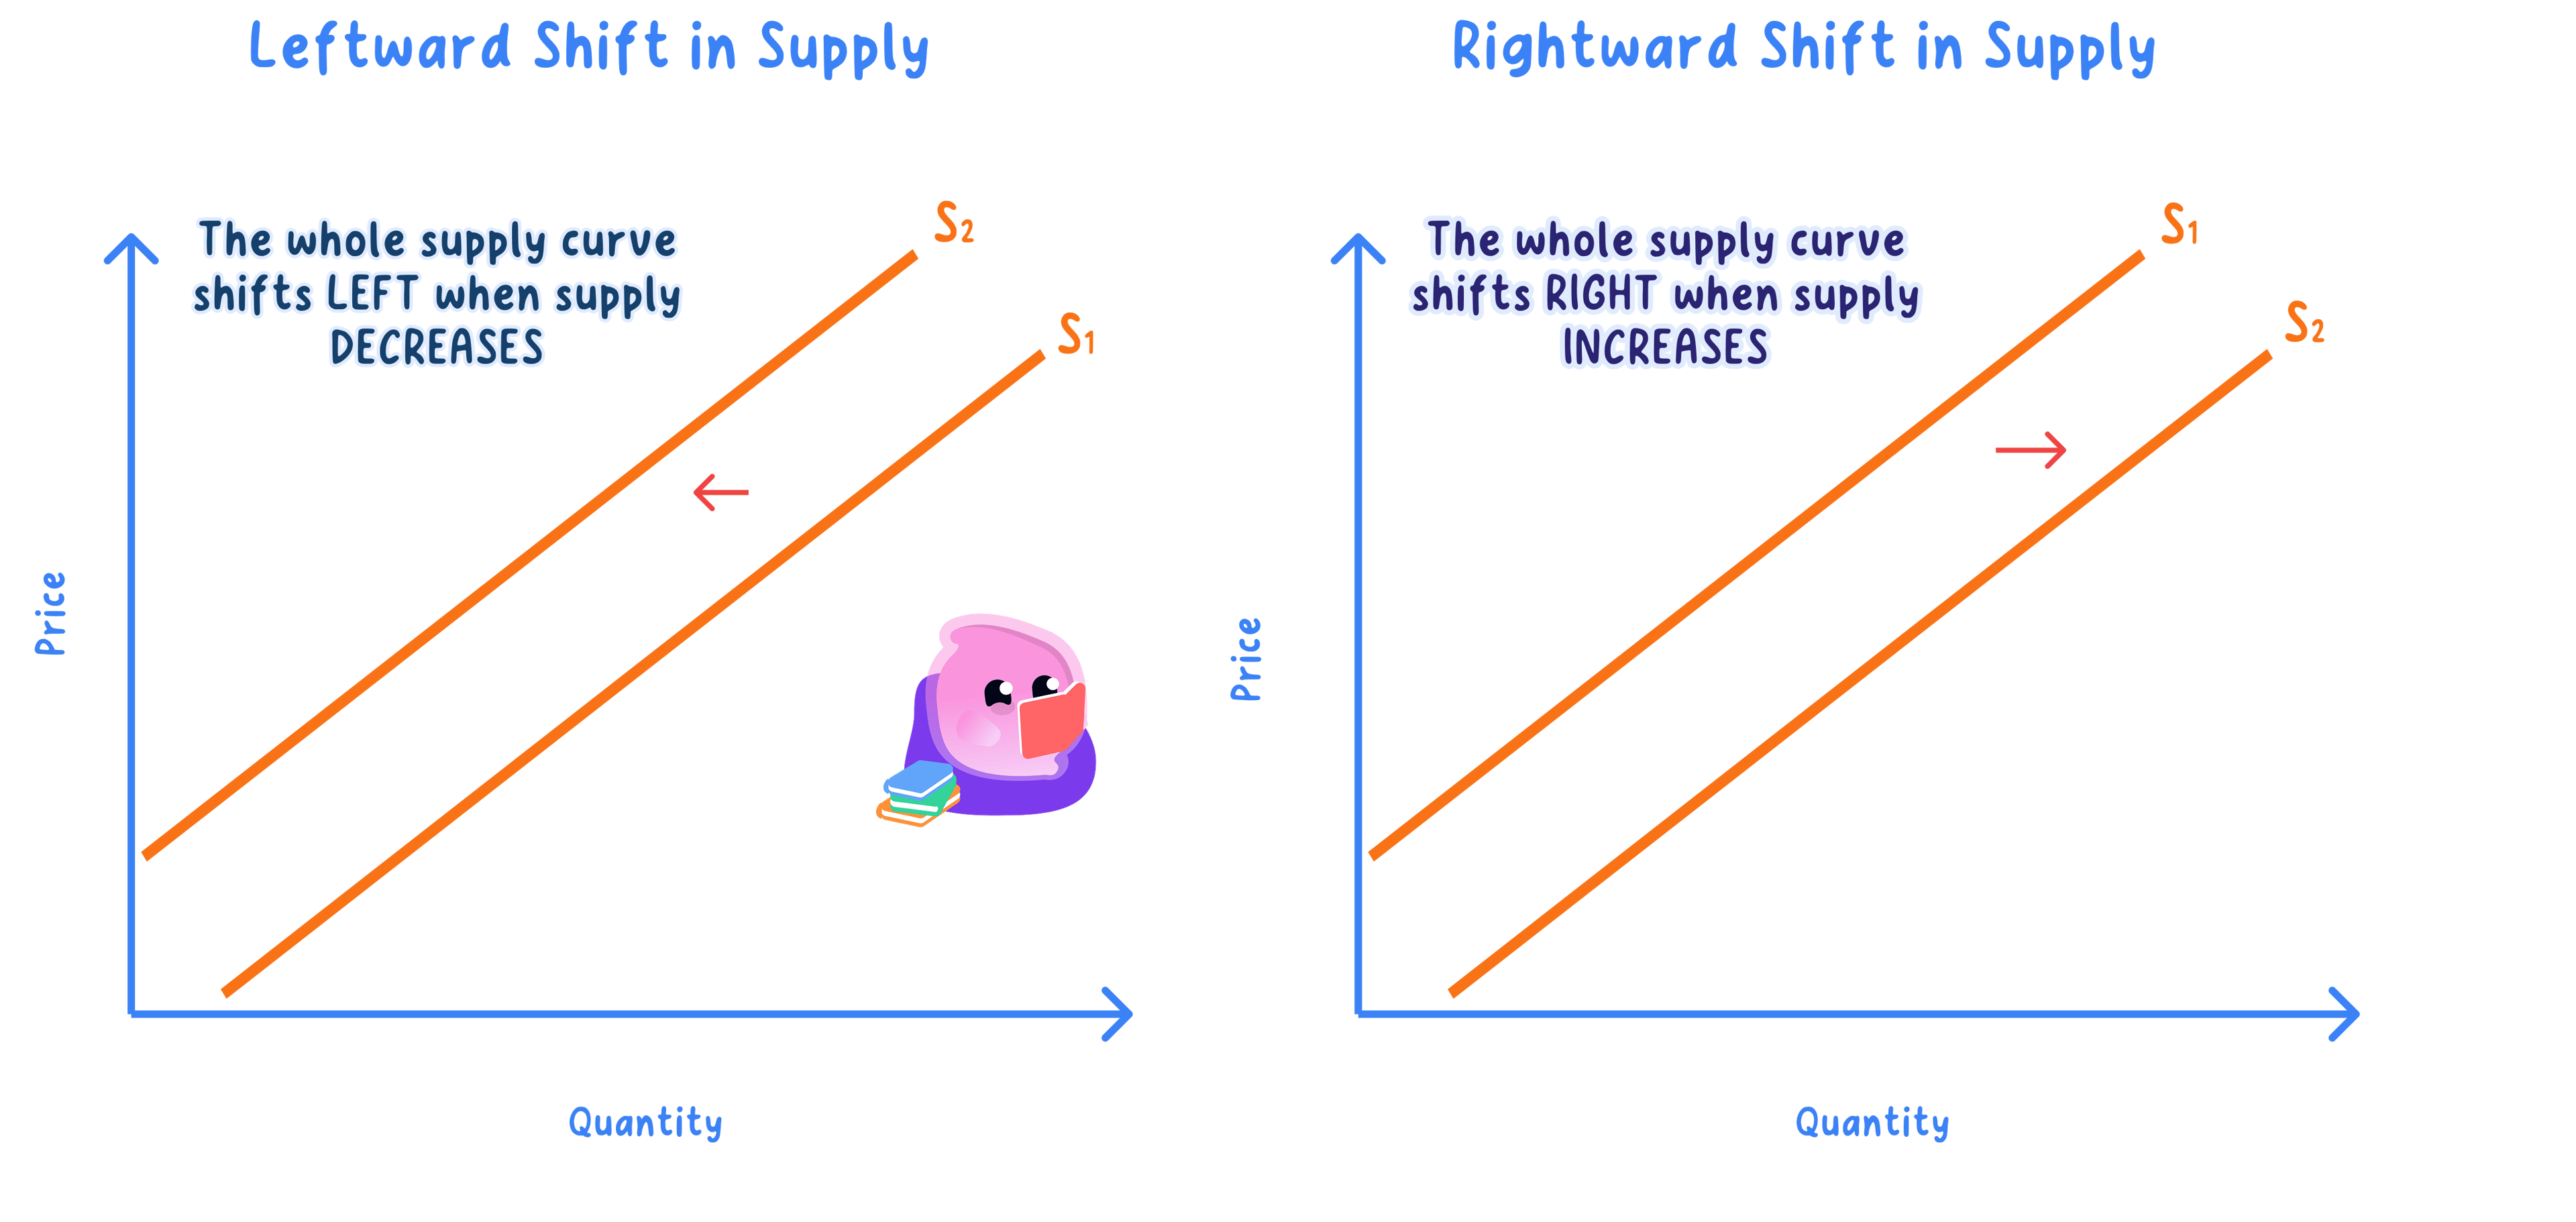
- An increase in supply moves the whole curve to the right, so a larger quantity is supplied at every price.
- On an upward-sloping line that rightward shift also sits lower down the page, which is why it is sometimes called a shift downwards.
- A decrease in supply moves the whole curve to the left, so a smaller quantity is supplied at every price.
- Draw the second curve as a complete line roughly parallel to the first, label it S2, and add an arrow showing which way it has gone.
- Use increase and decrease for a shift, and extension and contraction for a movement.
- The same dairy farm after fitting a new milking parlour: the schedule shows litres a day before and after the investment, with farmgate prices unchanged.
| Price per litre | Litres a day before | Litres a day after |
|---|---|---|
| 30p | 1,800 | 2,500 |
| 35p | 2,400 | 3,100 |
Step 1: at 30p, subtract the old quantity from the new one.
2,500−1,800=700 litres a day 2{,}500 - 1{,}800 = 700\text{ litres a day} 2,500−1,800=700 litres a dayStep 2: do the same at 35p.
3,100−2,400=700 litres a day 3{,}100 - 2{,}400 = 700\text{ litres a day} 3,100−2,400=700 litres a day- The farm offers 700 more litres a day at both prices, so the whole curve has shifted right from S to S1: an increase in supply.
Shift or movement? Ask one question
- Find the change the question describes and ask whether it is the price of this good.
- If it is, slide along the existing curve and call it an extension or a contraction of supply.
- If it is anything else, draw a second curve labelled S1 and call it an increase or a decrease in supply.
- A tax, a subsidy, a wage rise or a poor harvest all shift the curve, because none of them is the price of the good.
- Read a shift at one fixed price and quote both quantities, such as 1,800 then 2,500 litres at 30p.
- An extension of supply follows a price rise, while an extension of demand follows a price fall.
- Costs, taxes and weather shift the curve; only the good's own price slides the firm along it.
- How is a supply schedule turned into a supply curve?
- Why does the supply curve slope upwards?
- What is the only cause of a movement along the supply curve?
- Using the dairy farm figures, how many extra litres a day were supplied at 35p after the new parlour?
- How would you show a decrease in supply on a diagram?
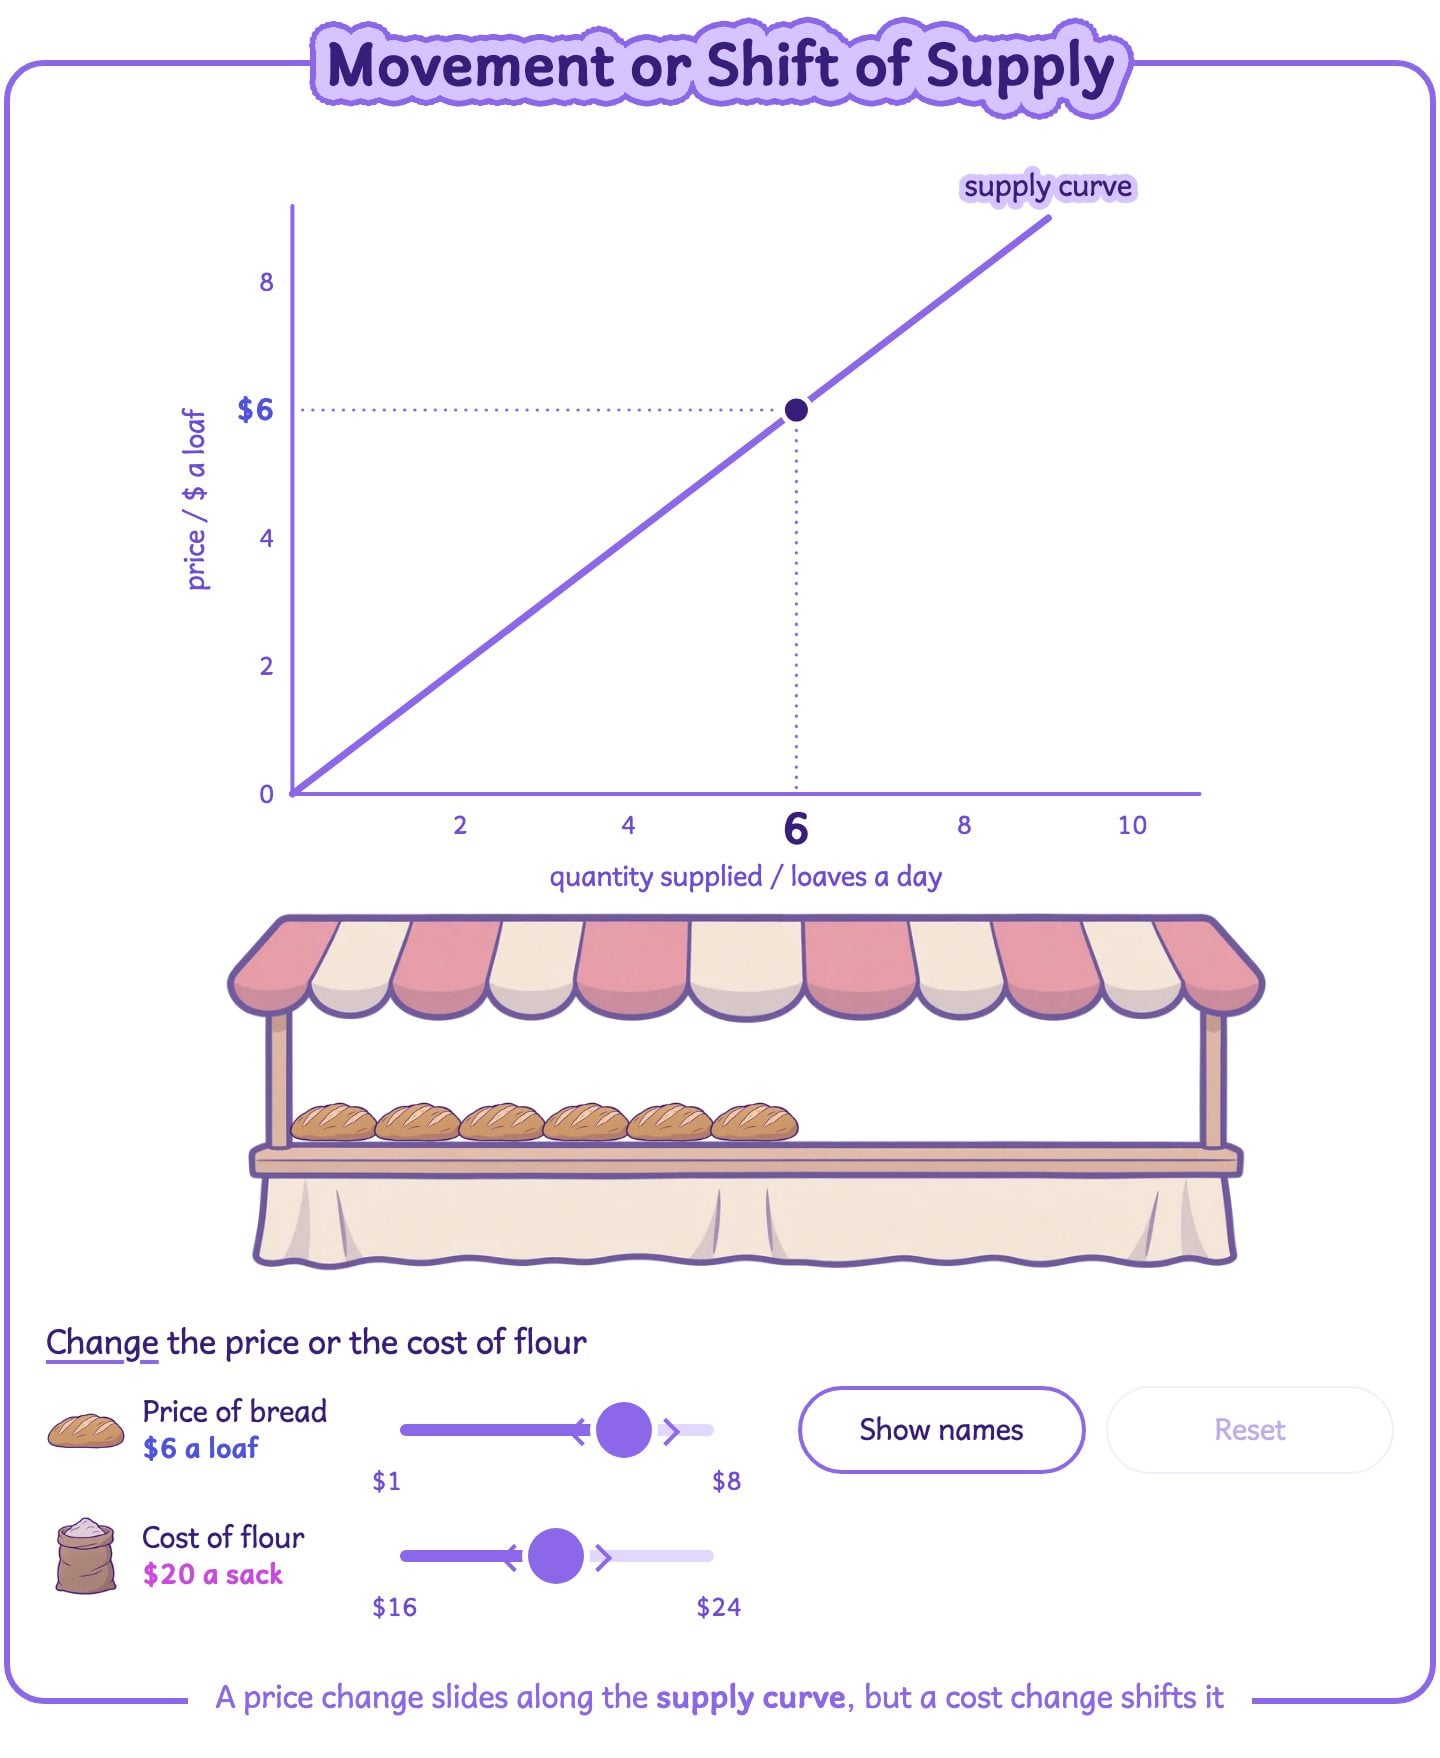
Change the price, then change costs, and notice that only a cost change shifts the whole supply curve.