Plot the schedule to get the curve
Demand schedule: a table of prices with the quantity a consumer would buy at each of those prices.
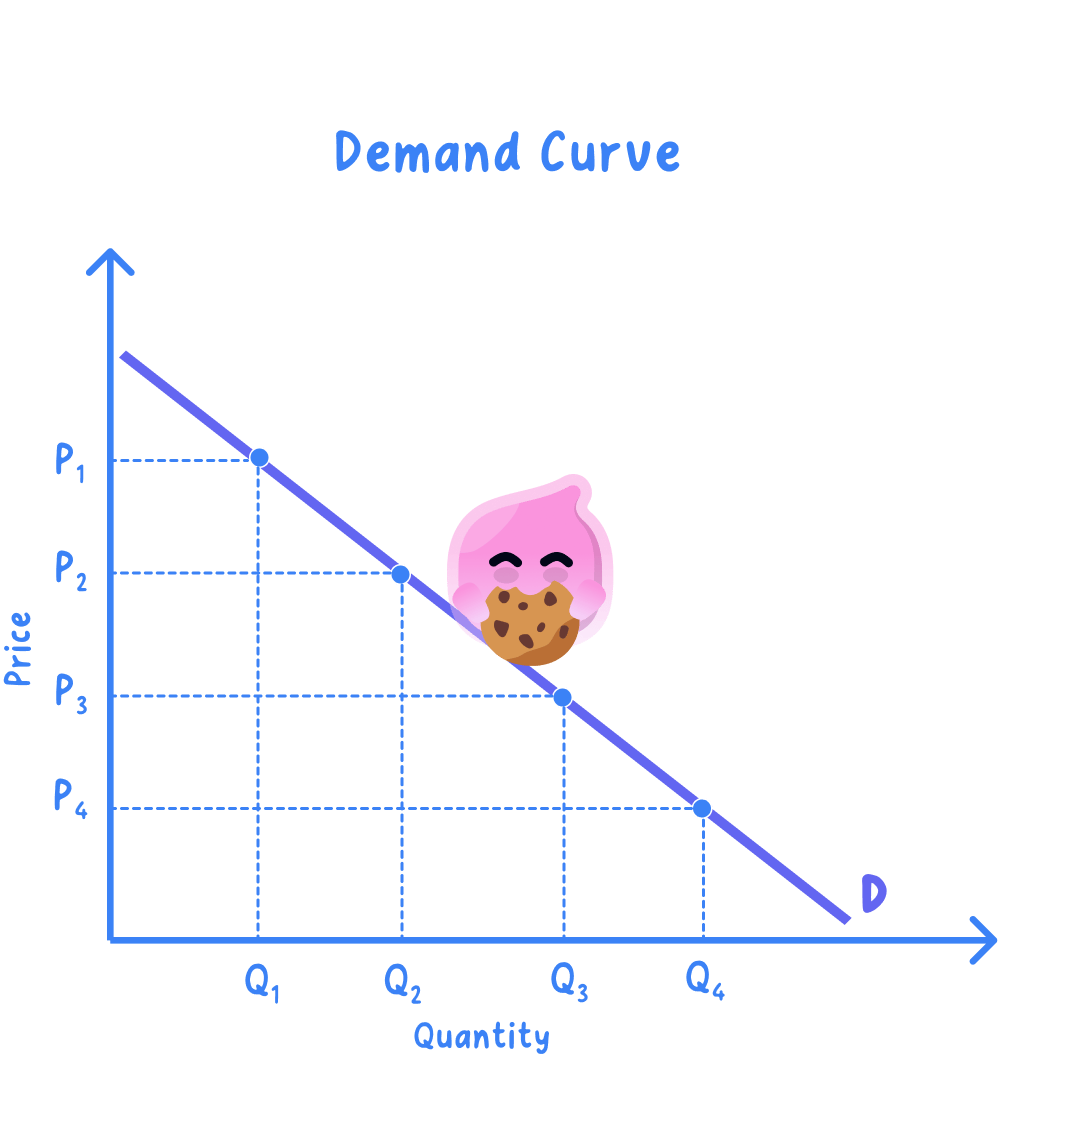
Demand curve: the same information drawn as a line, with each row of the schedule plotted as one point.
Demand itself, and the non-price factors that change it, are set out in section 1.3.1a.
- Price goes on the vertical axis and quantity demanded on the horizontal axis, on every demand and supply diagram.
- Plot each row as one point, join them into a single line falling from top left to bottom right, and label it D.
- The finished curve assumes nothing but price has changed, which economists call ceteris paribus.
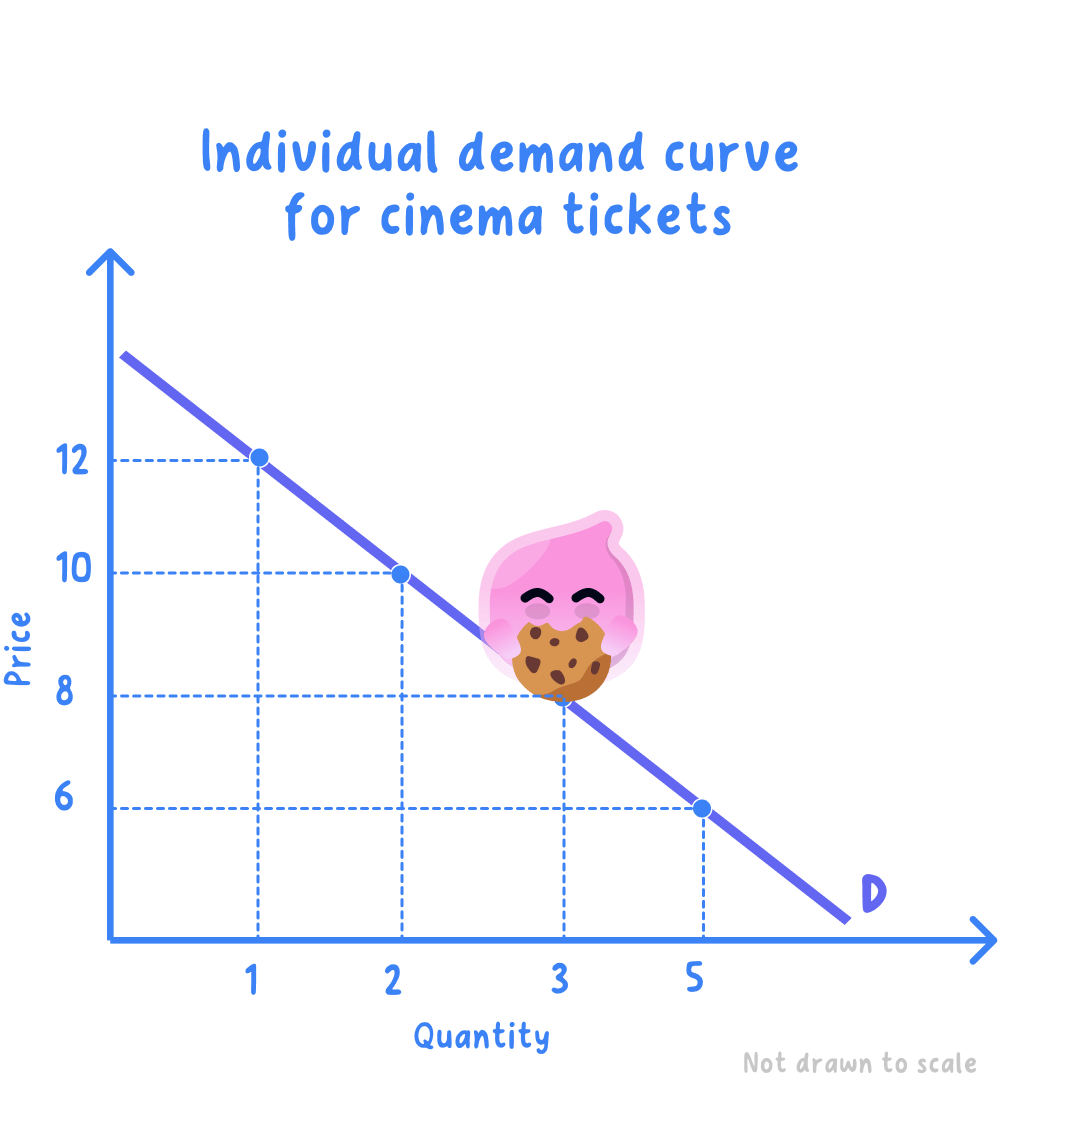
- One student's cinema tickets: the schedule shows how many tickets she would buy in a month at each price.
| Price per ticket | Tickets a month |
|---|---|
| £12 | 1 |
| £10 | 2 |
| £8 | 3 |
| £6 | 5 |
Step 1: plot £12 against 1 ticket, £10 against 2, £8 against 3 and £6 against 5, then join the points and label the line D.
Step 2: subtract the quantity at the highest price from the quantity at the lowest.
5−1=4 tickets a month 5 - 1 = 4\text{ tickets a month} 5−1=4 tickets a month- A fall from £12 to £6 raises her quantity demanded by 4 tickets a month, and all four points sit on the one curve D.
Why the demand curve slopes downwards
- A lower price brings in buyers who could not afford the good before, so more people become willing and able to buy it.
- A lower price also makes the good cheaper against the goods it competes with, so some buyers switch across to it.
- People already buying tend to take extra units, because each further unit now costs them less.
- All three effects push the same way, which is the law of demand: price and quantity demanded move in opposite directions.
- Never put quantity on the vertical axis: swapped axes cannot be credited.
- Do not draw a second curve for a price cut: only a non-price factor gives a new curve.
A price change slides you along D
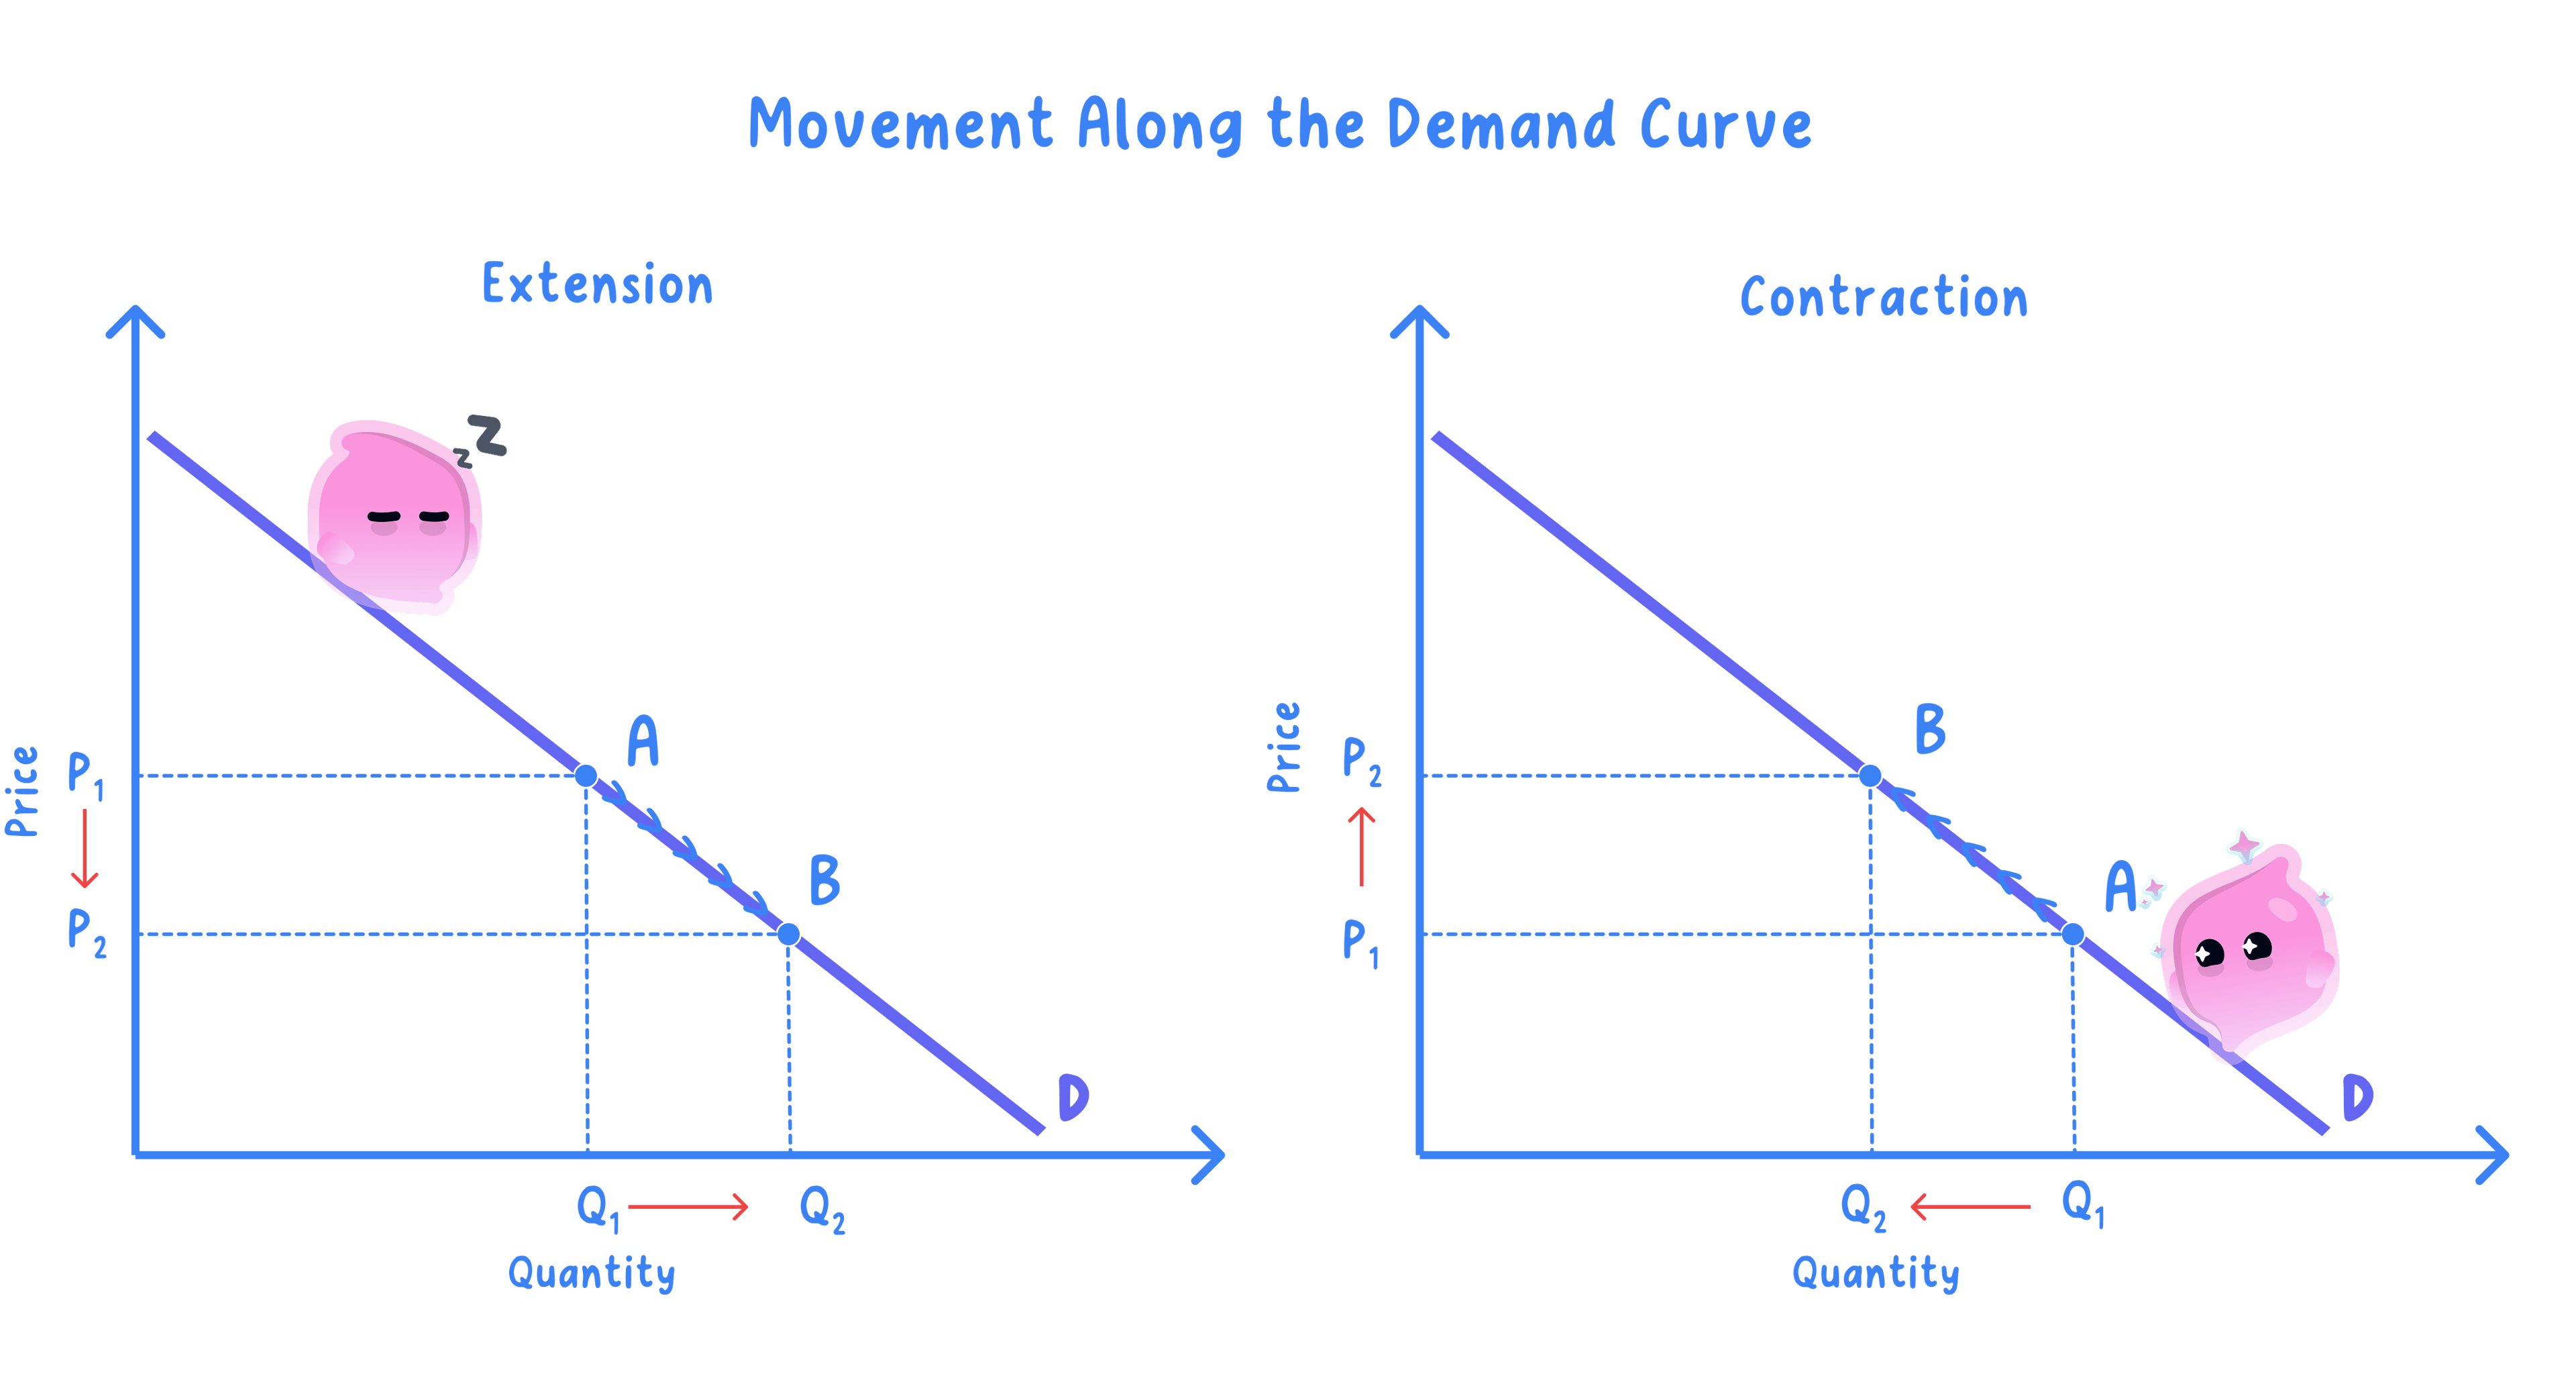
Movement along the demand curve: a change from one point on the curve to another point on the same curve, caused only by a change in the good's own price.
Extension of demand: a rise in quantity demanded after a fall in the good's own price, shown by sliding down the curve to the right.
Contraction of demand: a fall in quantity demanded after a rise in the good's own price, shown by sliding up the curve to the left.
- The curve does not move and the label D stays put; what moves is the point being read.
- Mark the two points A and B, and label P1, P2, Q1 and Q2 so the coordinates you moved between are visible.
A shift changes demand at every price
- A shift happens only when something other than the good's own price changes, which means one of the factors in section 1.3.1a.
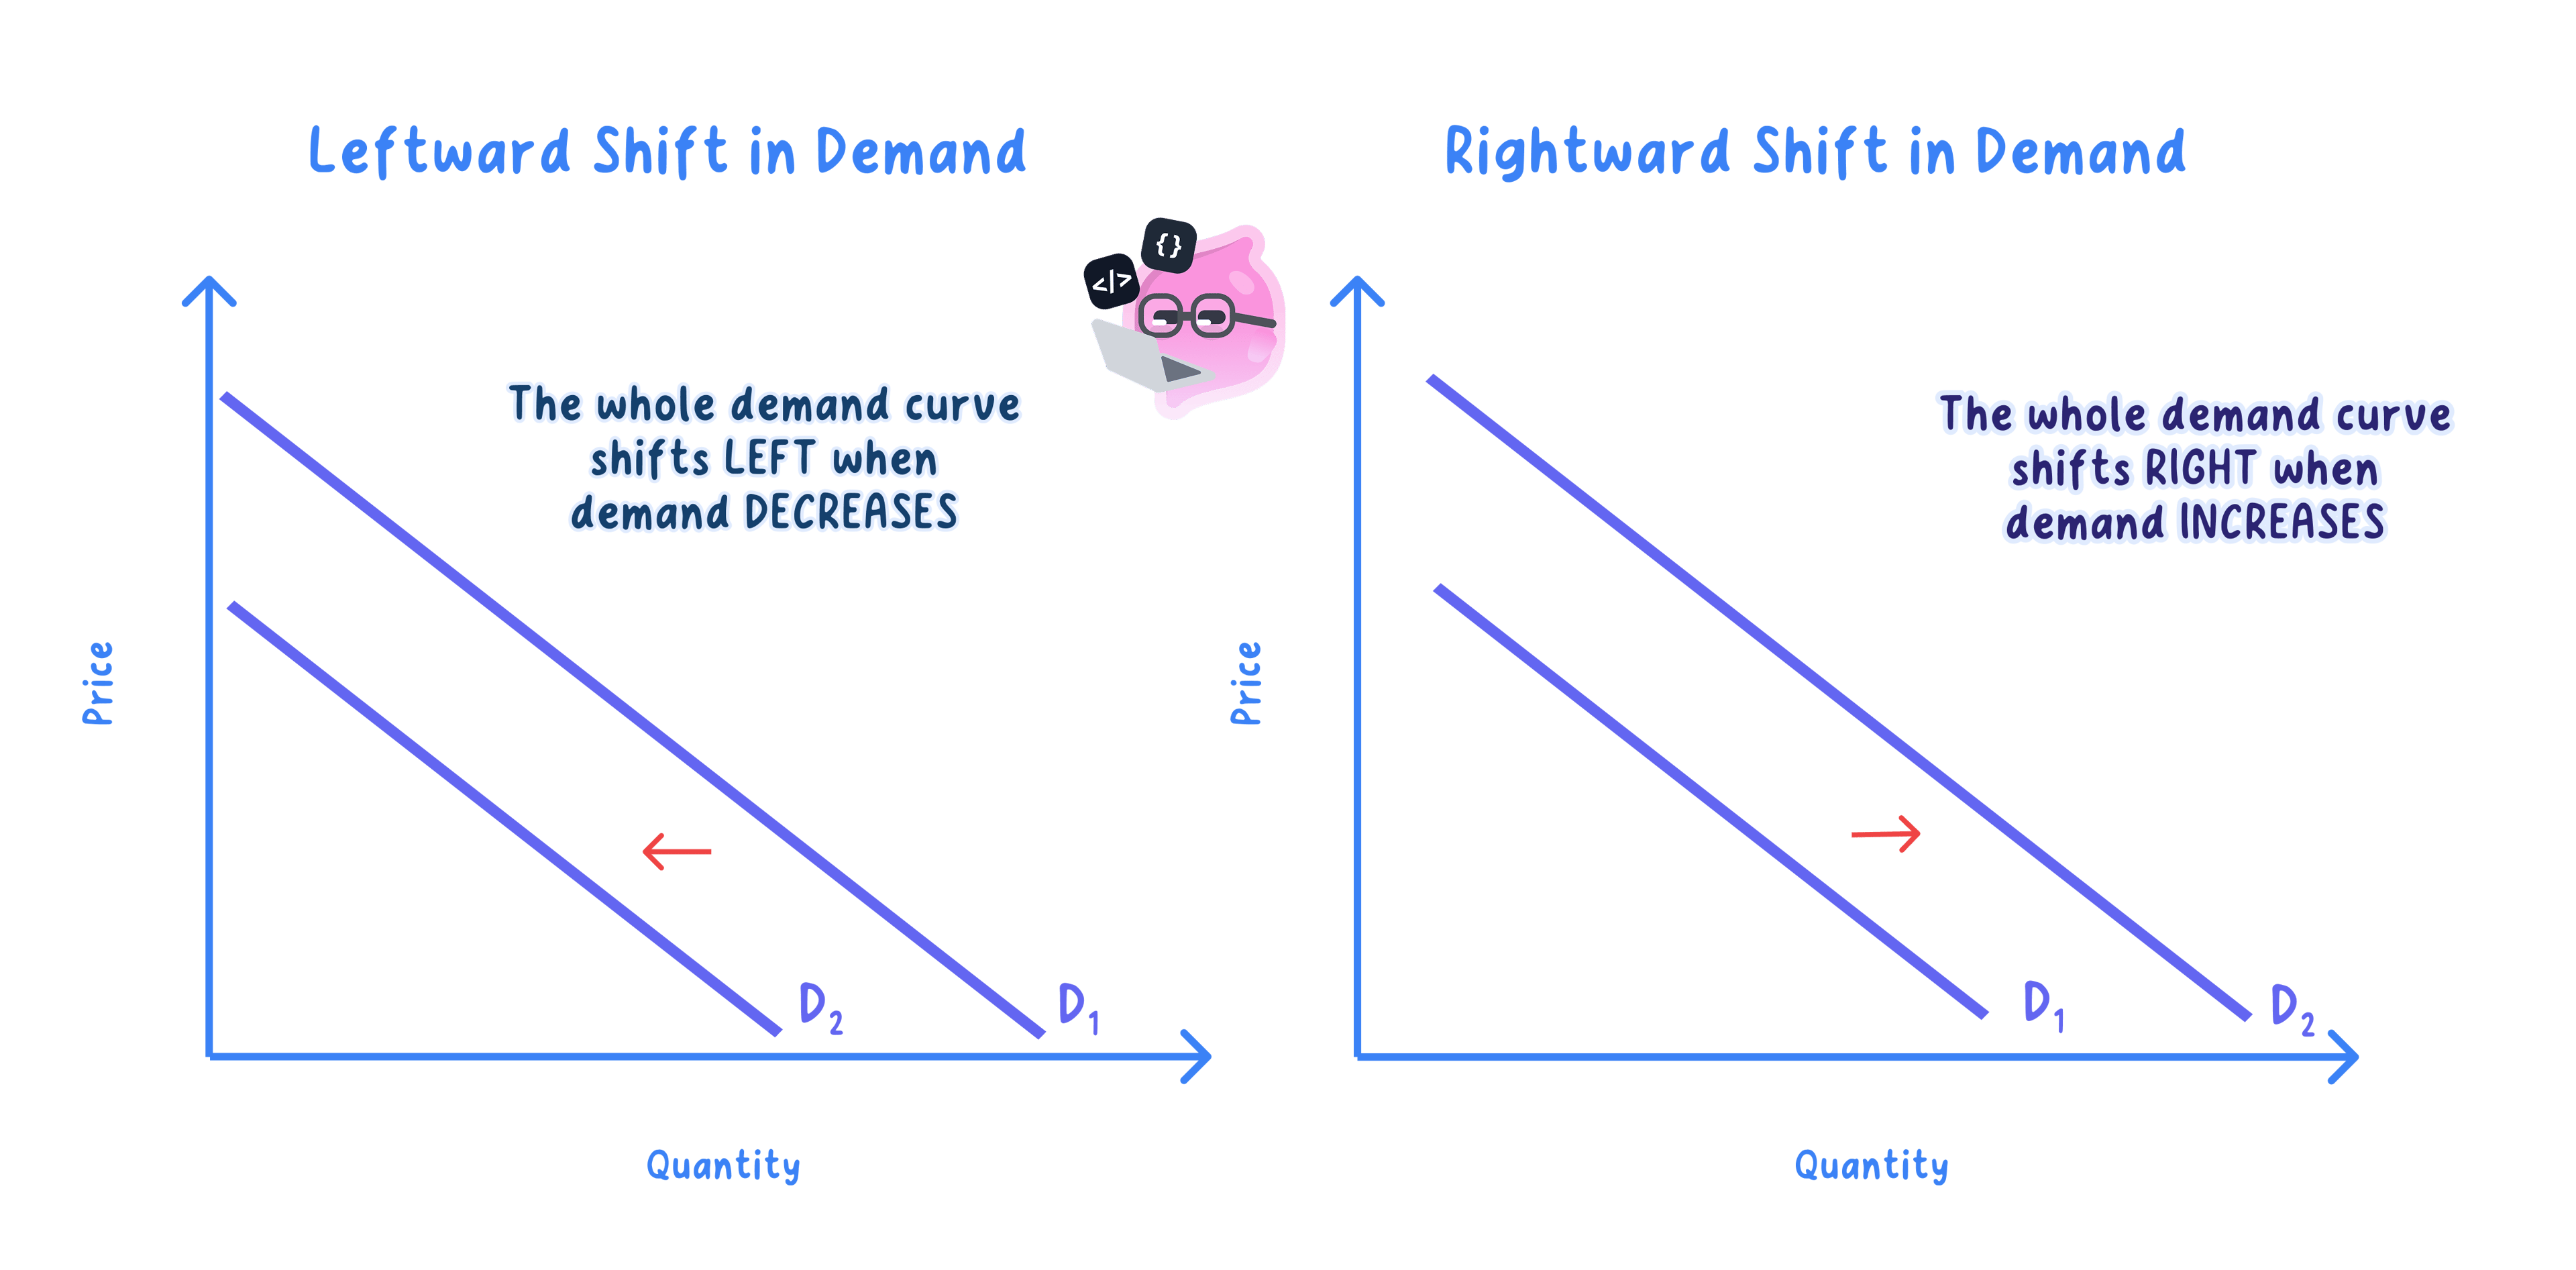
- An increase in demand moves the whole curve to the right, so a larger quantity is demanded at every price.
- A decrease in demand moves the whole curve to the left, so a smaller quantity is demanded at every price.
- Draw the second curve as a complete line roughly parallel to the first, label it D2, and add an arrow showing which way it has gone.
- Use increase and decrease for a shift, and extension and contraction for a movement.
- A high street coffee shop after new offices open nearby: the schedule shows cups a day before and after the offices filled up, with menu prices left alone.
| Price per cup | Cups a day before | Cups a day after |
|---|---|---|
| £3.00 | 250 | 400 |
| £2.00 | 400 | 560 |
Step 1: at £3.00, subtract the old quantity from the new one.
400−250=150 cups a day 400 - 250 = 150\text{ cups a day} 400−250=150 cups a dayStep 2: do the same at £2.00.
560−400=160 cups a day 560 - 400 = 160\text{ cups a day} 560−400=160 cups a day- More is wanted at both prices with no price change, so the whole curve has shifted right from D to D1: an increase in demand.
Shift the curve, or slide along it?
- Find the change the question describes and ask whether it is the price of this good.
- If it is, slide along the existing curve and call it an extension or a contraction.
- If it is anything else, draw the second curve and call it an increase or a decrease in demand.
- Watch for a related good: the price of a substitute or a complement is not the price of this good, so it shifts this curve.
- Label both axes and the curve D before showing any change, because an unlabelled curve earns nothing.
- Show a movement as two labelled points on one curve, and a shift as a second curve D1 with an arrow.
- A substitute's or complement's price shifts this curve, so never read it as a movement along it.
- Which variable goes on the vertical axis?
- Give one reason the demand curve slopes downwards.
- What is the only cause of a movement along the demand curve?
- Using the coffee shop figures, how many more cups a day were demanded at £2.00 after the offices opened?
- How is a decrease in demand shown on a diagram?
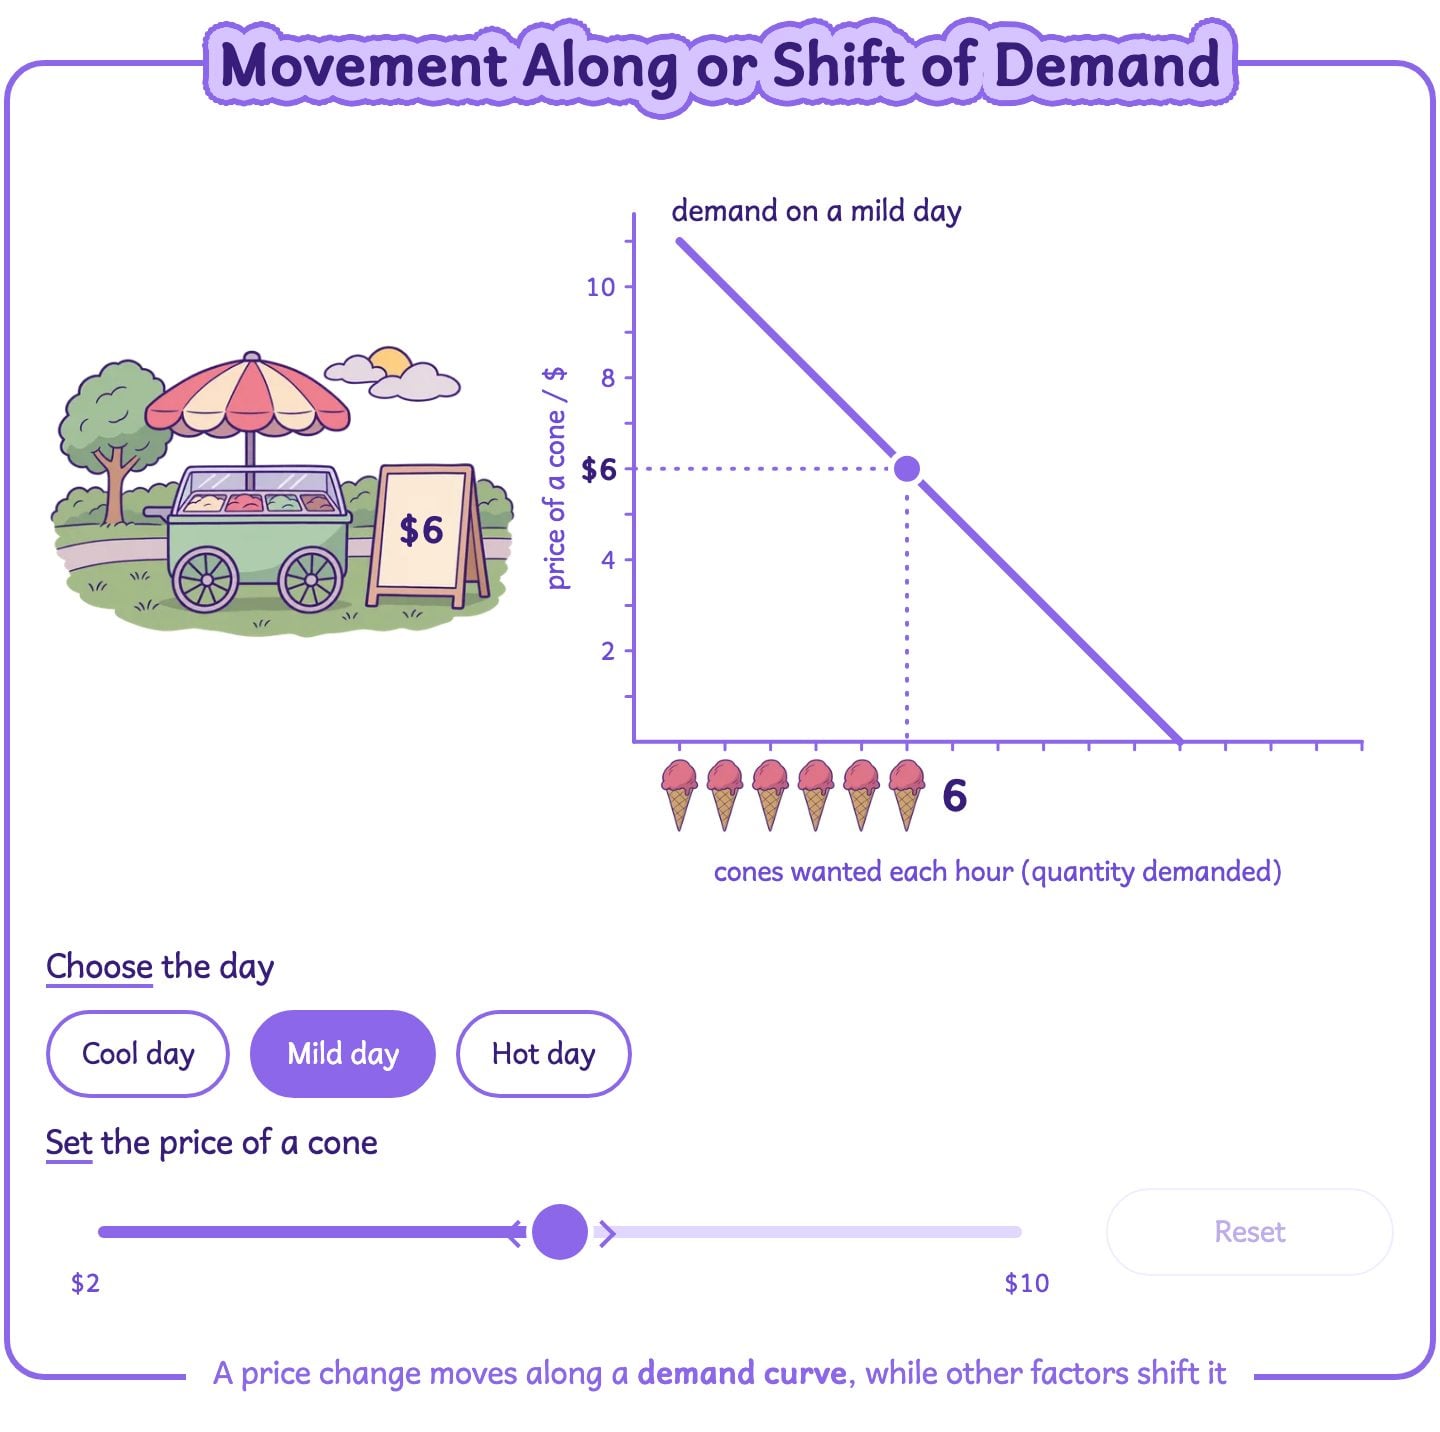
Change the price, then change income or tastes, and notice that only non-price factors shift the whole demand curve.