Divide the output reaction by the price change
Percentage change=changeoriginal figure×100% \text{Percentage change}=\frac{\text{change}}{\text{original figure}}\times100\% Percentage change=original figurechange×100% PES=percentage change in quantity suppliedpercentage change in price \text{PES}=\frac{\text{percentage change in quantity supplied}}{\text{percentage change in price}} PES=percentage change in pricepercentage change in quantity supplied- Calculate each percentage change from the original price or quantity, then divide the quantity-supplied change by the price change.
- PES is normally positive because price and quantity supplied move in the same direction.
Common Mistake
- Do not invert the fraction.
- Use the original figures as the denominators.
The same three steps work every time
-
- Find the percentage change in quantity supplied. 2. Find the percentage change in price. 3. Divide the first by the second.
Example
- The price of a chair rises from £40 to £42 and weekly output rises from 500 to 600 chairs.
- PES of 4 means supply is price elastic over this range.
Read the coefficient against 1
- Compare PES with 1.
- 0 < PES < 1 means supply is inelastic: quantity supplied changes proportionally less than price.
- PES = 1 means supply is unit elastic: the two percentage changes are equal.
- PES > 1 means supply is elastic: quantity supplied changes proportionally more than price.
- PES = 0 is perfectly inelastic; a vertical supply curve.
- Perfectly elastic supply is shown by a horizontal supply curve.
- A steep supply curve is usually less elastic than a flatter one, but use the calculation when values are given.
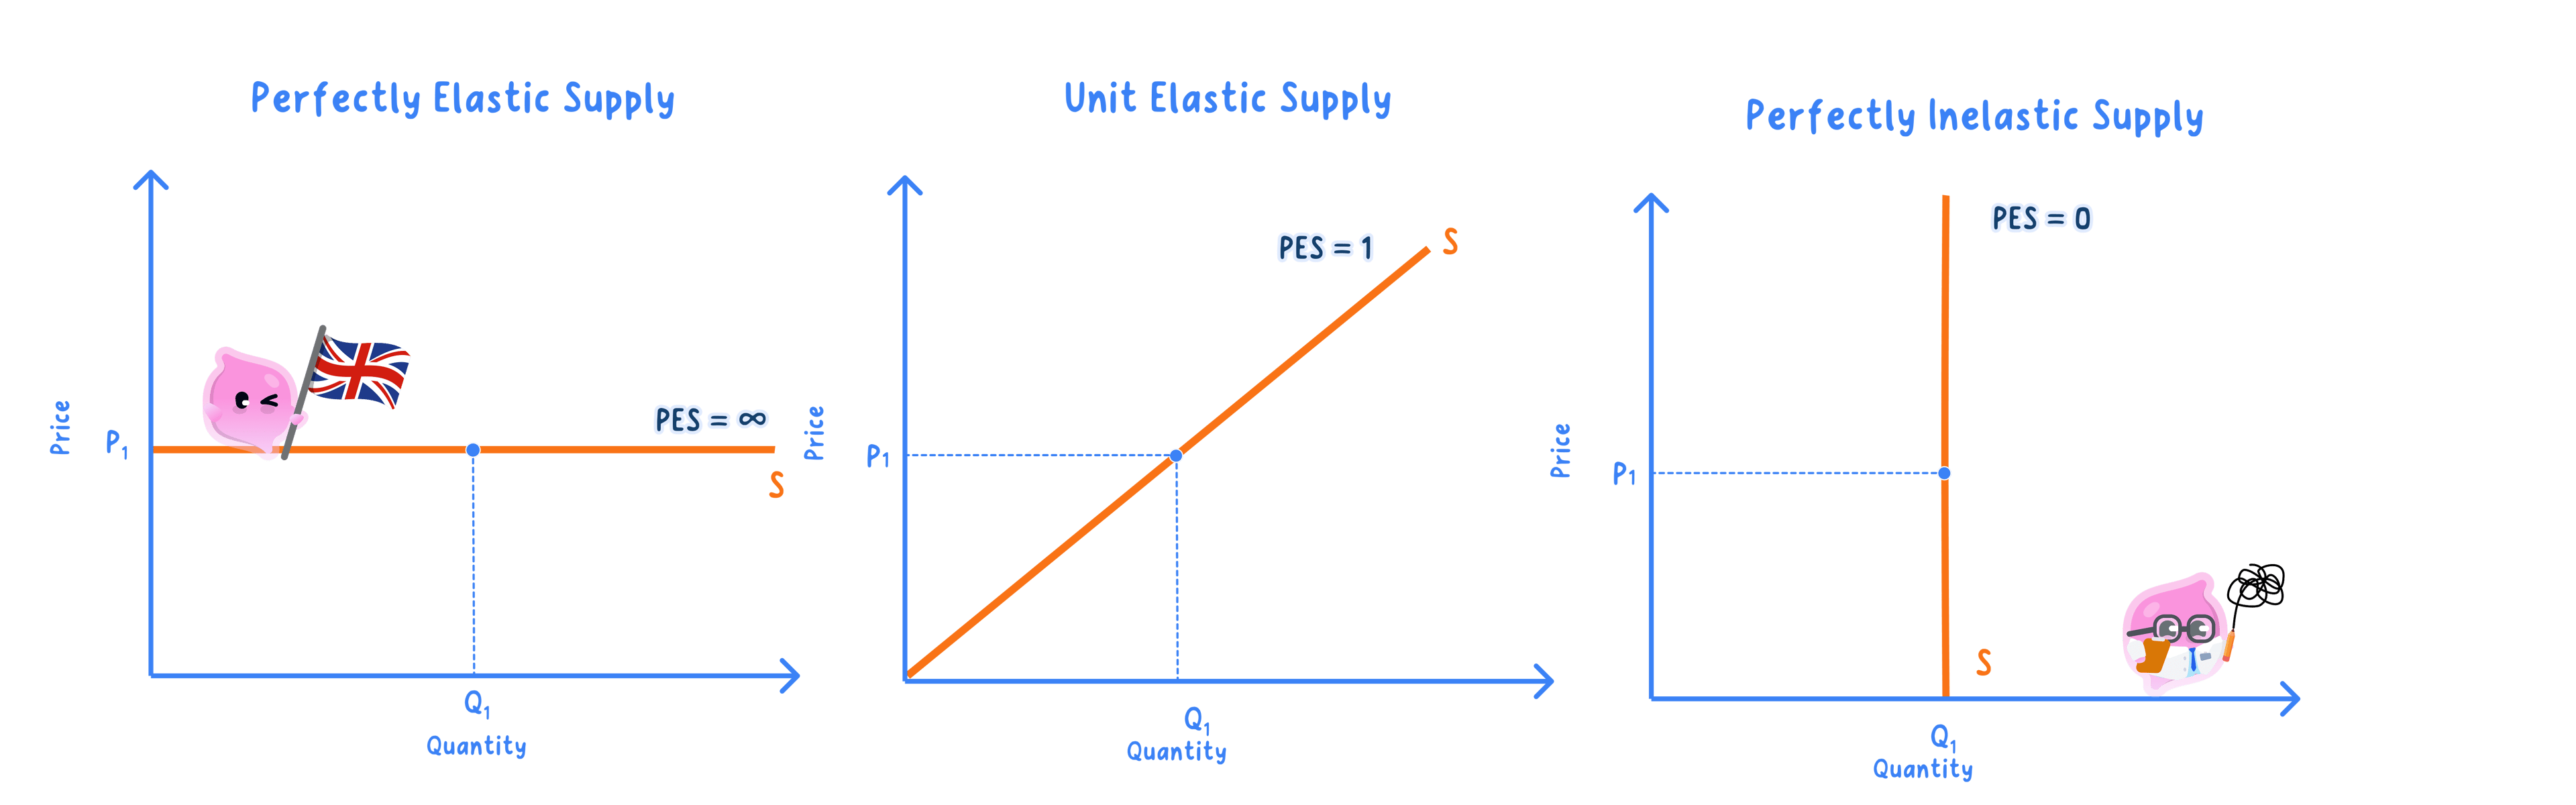
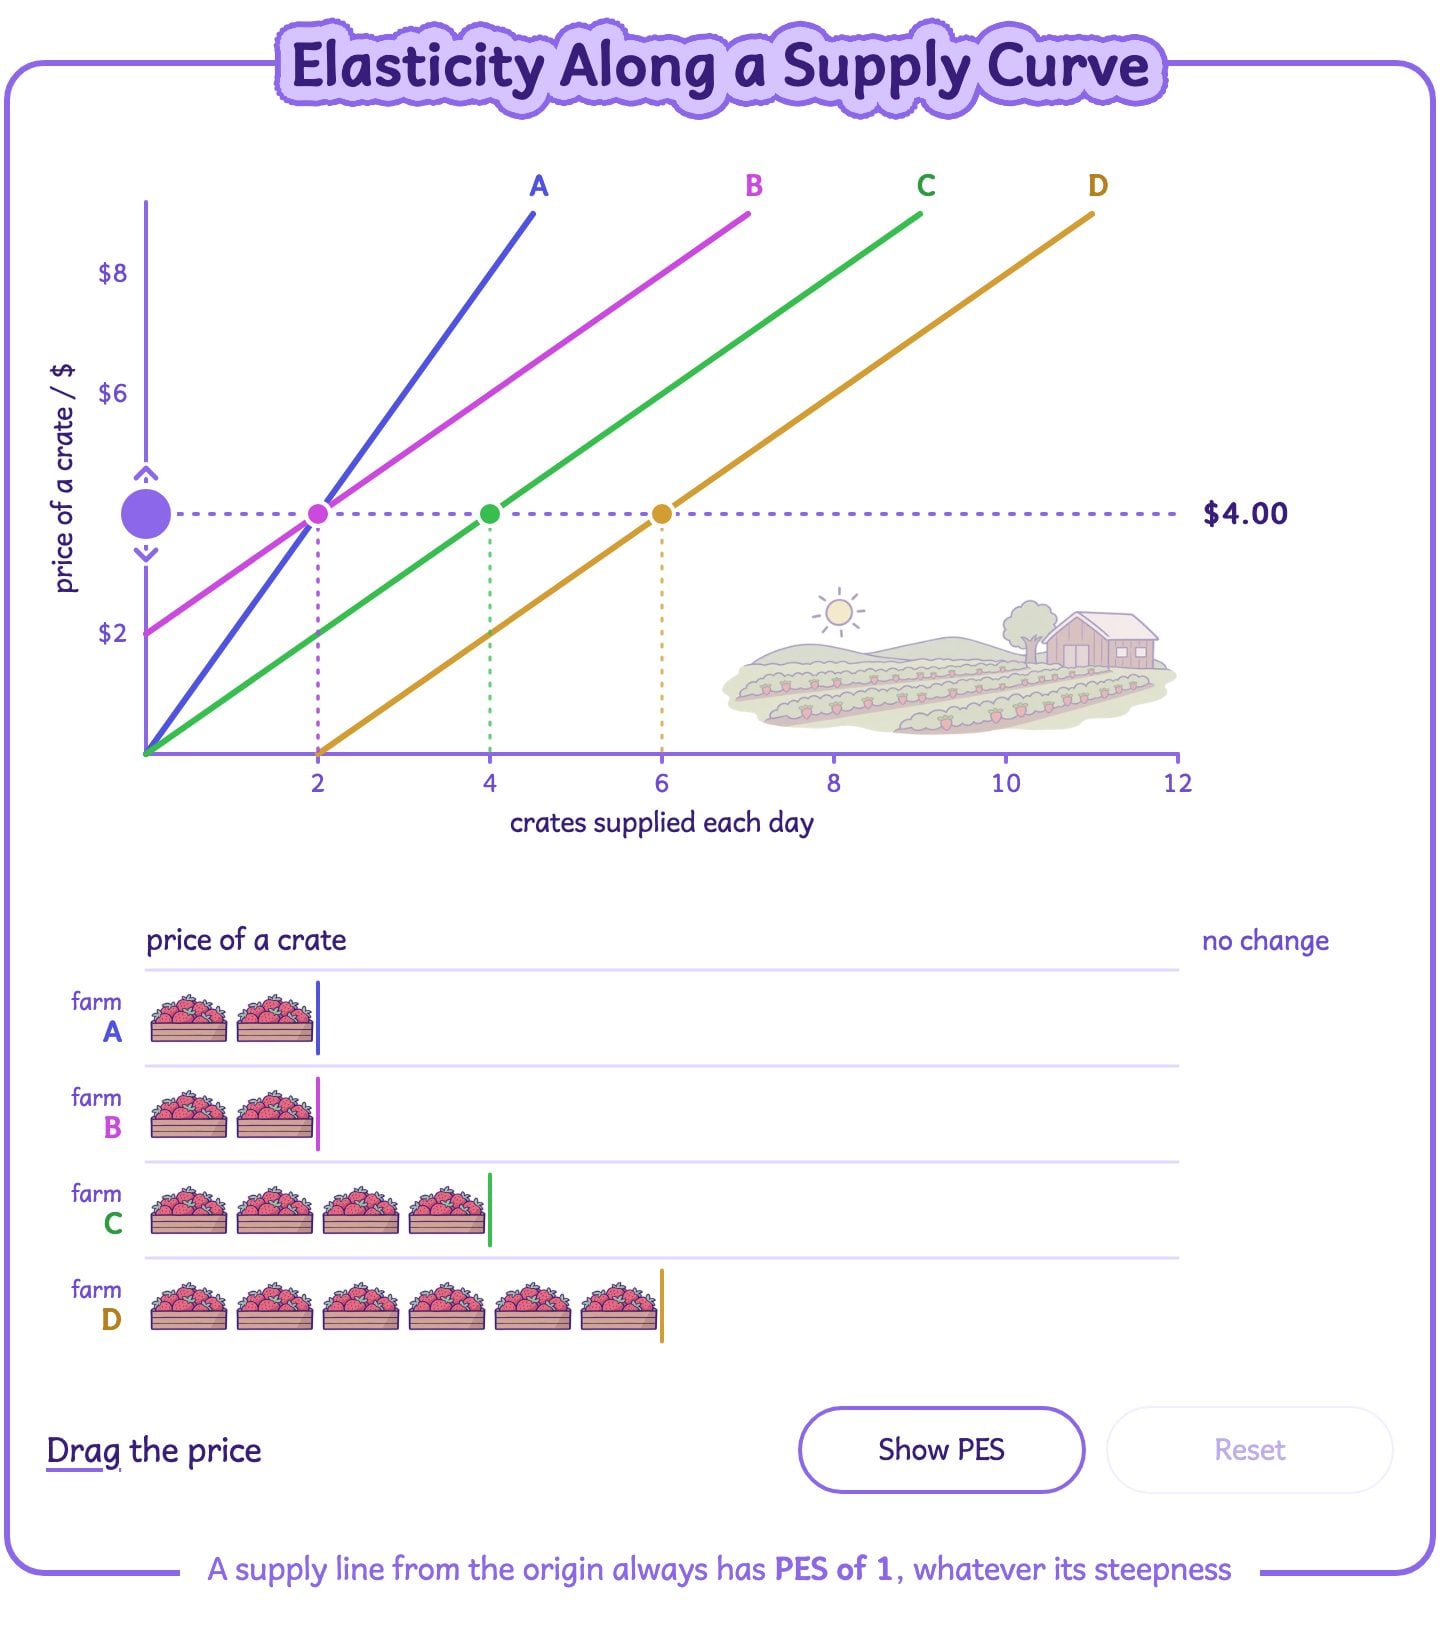
Compare where each supply line meets the axes and notice whether its PES is above, equal to or below 1.
Implications for producers and consumers
- After a rise in demand, inelastic supply tends to produce a larger rise in price and a smaller rise in quantity than elastic supply.
- A producer with inelastic supply can increase output only a little when price rises; spare capacity, stocks and time make supply more elastic.
Example
- If price rises by 10%, PES of 0.3 gives a 3% rise in quantity supplied; PES of 4 gives a 40% rise.
- This predicts the supply response only. The exact new market price also depends on demand.
Supply becomes more elastic over a longer time period
- Supply is often more inelastic in the short run because firms cannot quickly add workers, machinery or capacity.
- Over a longer period, firms may be able to expand capacity, so supply can become more elastic.
Example
- Housing illustrates short-run inelastic supply: building more homes takes time, so a demand increase can put stronger upward pressure on price.
- It does not allow an exact new house price to be calculated from PES alone; the demand curve also matters.
Every coefficient belongs to one range and period
- PES can change across different price ranges.
- PES also changes over time as firms gain capacity, stocks or workers.
- It depends on how the market is defined: one firm’s supply may be less elastic than the supply of the whole industry.
- Quote the period and price range when interpreting a PES figure.
Exam technique
- Show both percentage changes using the original figures, then state the PES and the correct elastic/inelastic verdict.
- Use PES × percentage price change to find the percentage change in quantity supplied.
Self review
- State the PES formula in words.
- If price rises by 20% and quantity supplied rises by 4%, calculate PES and classify supply.
- Why is supply often more elastic in the long run?
- Why cannot PES alone calculate the exact new equilibrium price?