Beyond a point, more output raises unit costs
Definition
Diseconomies of scale: a rise in the average cost of production as a firm raises its output beyond a certain size.
Optimum output: the level of output at which a firm's average cost is at its lowest.
- Section 1.4.3a followed average cost downwards as a firm grew, and diseconomies are simply what happens on the far side of the lowest point.
- The trigger is the same rise in production, so the two ideas differ in effect rather than in cause.
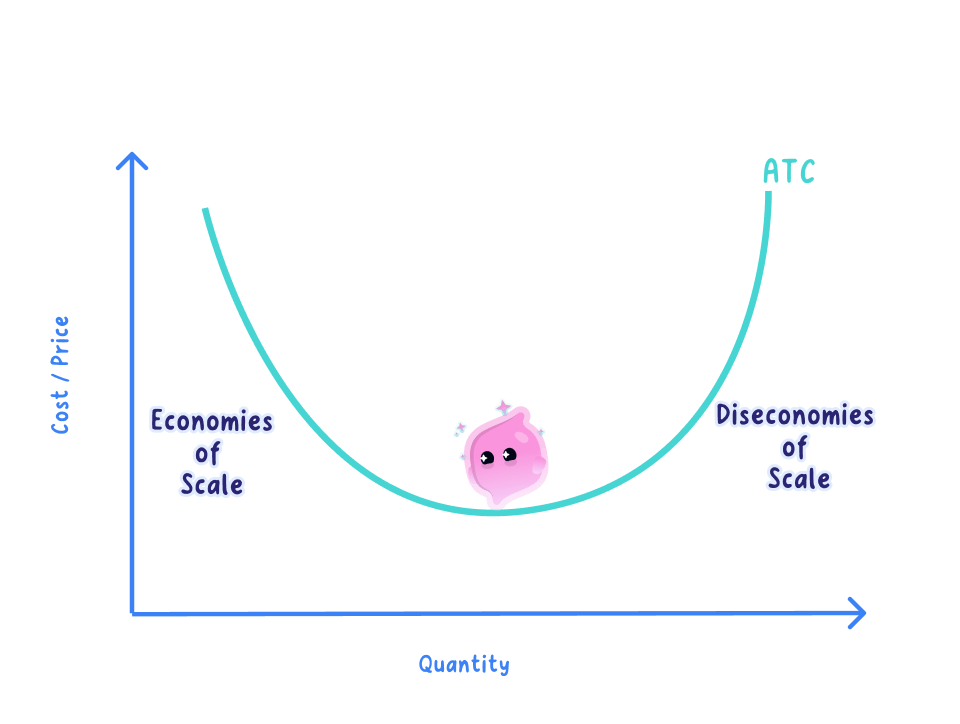
- Average cost sits on the vertical axis and output on the horizontal axis: the curve falls, hits a minimum, then rises again, the characteristic U shape.
- The output at that minimum is the optimum output: growing towards it lowers average cost, growing past it raises it.
The causes are organisational, not technological
- Communication breaks down: a message in a firm of tens of thousands passes through several layers of management and arrives late, incomplete or changed, so decisions are made on stale information.
- In an Amazon UK fulfilment centre of several thousand staff, a change to a picking rule that reaches one shift and not the next produces a day of wasted work that still has to be paid for.
- Coordination and duplication get expensive: more sites, product lines and departments need more managers, meetings and monitoring, and none of that adds a single unit of output.
- The NHS employs around 1.5 million people across hundreds of separate organisations, and two trusts buying the same equipment on different contracts raises the cost per patient treated.
- Worker motivation weakens: a worker who never meets a manager, and whose effort makes no visible difference to a business of this size, has little reason to push, so lower output per worker, more absence and higher turnover all mean the same wage bill buys fewer units.
- Management layers turn into bureaucracy: each new layer of managers, forms and approvals is a salary and a delay, and waste is harder to see from the top, so departments duplicate each other's work and nobody is answerable for the total.
- Quality gets harder to monitor: checking standards across roughly 2,600 Greggs shops or hundreds of Tesco stores costs money, and every batch thrown away or replaced is paid for out of the same output.
Example
- The bakery from 1.4.3a pushed past its best size: one site handles 60,000 loaves a week on fixed costs of £12,000 and £0.40 a loaf, but 100,000 loaves needs three sites, so fixed costs rise to £20,000 and overtime and supervision push the variable cost to £0.55 a loaf.
- Output rose by two thirds and every loaf now costs 15p more, which is £15,000 a week thrown away on the extra size alone. Average cost is lowest at 60,000 loaves, so 60,000 is this bakery's optimum output and everything past it is a diseconomy of scale.
Diseconomies depend on organisation, not just size
- It depends on how the firm is structured, because splitting a business into divisions with their own budgets and targets restores the short lines of command that made it cheap when it was small.
- It depends on how well information moves, since shared stock and sales systems let a head office see every store in real time, which is why national grocers can run thousands of shops without losing control of them.
- It depends on how workers are managed and paid, as bonuses, team working, promotion from the shop floor and giving staff real decisions all recover motivation that sheer size takes away.
- It depends on how far past the optimum the firm has gone, because a small overshoot costs pennies a unit while a firm that has doubled past its best size may have given back every economy it ever gained.
- It depends on the industry, since a firm assembling a standard product on one site can grow very large before coordination bites, while a firm whose service is delivered face to face runs into the limit far sooner.
Note
Judgement: diseconomies of scale can be delayed but not abolished, because every device that fixes them, whether divisions, information systems or bonuses, is itself a cost paid out of the same output, so good organisation moves a firm's optimum output further out rather than removing the limit altogether.
Diseconomies limit growth but do not stop it
- Notice what is not being claimed: output is still rising past the optimum, sales may still be rising and total profit may still be rising, and only the cost of each unit has turned.
- A firm can therefore choose to accept a higher average cost to win a bigger market, which is why the largest firm in an industry is rarely the cheapest per unit.
- The decision is whether the extra volume is worth more than the pennies added to every unit, which is exactly the weighing up of the costs and benefits of growth in 1.4.3a.
Exam technique
- Label both axes and mark the minimum point when sketching the average cost curve; an unlabelled U earns nothing.
- For "evaluate", argue that size alone does not cause diseconomies; judge how well the particular firm is organised.
Self review
- Define diseconomies of scale.
- What is a firm's optimum output?
- A bakery's total cost is £36,000 at 60,000 loaves a week and £75,000 at 100,000 loaves. What happens to average cost, and by how much?
- Give two causes of diseconomies of scale and say how each one raises average cost.
- Where on a U-shaped average cost curve does the optimum output sit?