

What you'll learn
- What economists mean by demand for a good or service.
- The main factors that influence demand in real UK markets.
- How to construct an individual demand curve from consumer data.
- How to tell the difference between a movement along a demand curve and a shift of the whole curve.
3.1.3.1 Demand for goods and services
Starting point: goods, services and consumers
A good is a physical product you can buy, such as a Greggs sausage roll, a phone, or a train ticket printed on paper.
A service is something done for you, such as a haircut, a Netflix subscription, a bus journey, or a private tutoring lesson.
A consumer is a person or household that buys goods and services to satisfy needs and wants.
Demand
Demand is the quantity of a good or service that consumers are willing and able to buy at a given price, over a given period of time.
The words willing and able matter. Wanting something is not enough. If you want a £900 phone but cannot afford it, that is not demand at £900.
Deciding whether demand exists
A student says they “demand” a new games console priced at £450.
- Check willingness: if the student wants the console at £450, they are willing to buy it.
- Check ability to pay: if they only have £120 and cannot borrow or save enough, they are not able to buy it at £450.
- Apply the definition: because they are not willing and able, this is a want, not demand at that price.
Demand is price-specific
You should usually think: “Demand at what price?” The quantity demanded may be very different at £1, £5, or £50.
Quantity demanded and the price of the product
The quantity demanded is the amount consumers are willing and able to buy at one particular price.
For most goods and services, when the price rises, quantity demanded falls. When the price falls, quantity demanded rises.
This is called the law of demand.
Why? There are two simple reasons:
- At a lower price, more consumers can afford the product.
- Some consumers switch away from more expensive alternatives.
For example, if the price of a supermarket meal deal rises from £3.50 to £5, some students may bring lunch from home instead. If the price falls, more students may buy one.
Demand is not the same as quantity demanded
Demand usually means the whole relationship between price and quantity. Quantity demanded means one amount bought at one specific price.
The demand curve
A demand curve is a line on a graph showing how much of a good or service a consumer is willing and able to buy at different prices.
On a demand diagram:
- Price goes on the vertical axis.
- Quantity demanded goes on the horizontal axis.
- The demand curve usually slopes downwards from left to right.
Individual demand curve
An individual demand curve shows the quantity demanded by one consumer at different prices.
For GCSE Economics, you need to be able to construct a demand curve from consumer data. The data is often shown in a demand schedule, which is a table of prices and quantities demanded.
Constructing an individual demand curve from data
Suppose one consumer’s weekly demand for hot chocolates is:
| Price per hot chocolate | Quantity demanded per week |
|---|---|
| £1 | 5 |
| £2 | 4 |
| £3 | 3 |
| £4 | 2 |
| £5 | 1 |
Constructing an individual demand curve
- Put price on the vertical axis and quantity demanded on the horizontal axis, because demand diagrams always use this layout.
- Plot each pair of data as a point: £1 and 5, £2 and 4, £3 and 3, £4 and 2, £5 and 1.
- Join the points with a downward-sloping line and label it D for demand.
- Interpret the curve: at £2 the consumer demands 4 hot chocolates per week, but at £5 they demand only 1.
Axis order
In demand diagrams, remember P before Q: Price goes up the side, Quantity goes along the bottom.
Factors which influence demand
The price of the good itself affects quantity demanded. Other factors can change demand for the product at every price.
These non-price factors are sometimes called conditions of demand.
1. Income
Income is the money people receive, such as wages, salaries, benefits, interest or profits.
If people’s incomes rise, demand for many goods and services increases. For example, some households may buy more restaurant meals, holidays or branded products.
If incomes fall, demand for these products may decrease. During the 2022–23 cost-of-living squeeze, high energy, food and mortgage costs left many UK households with less spare income, so some switched from restaurants to supermarket meals or from branded groceries to cheaper own-label products.
2. Tastes, fashion and advertising
Tastes are consumers’ preferences: what they like and choose to buy.
Demand can rise if a product becomes fashionable or is strongly advertised. For example, demand for reusable water bottles, Stanley-style cups, or certain trainers can increase quickly because of social media trends.
Demand can also fall if tastes change. A product may become less popular if consumers see it as unhealthy, outdated, or bad for the environment.
3. Price of substitutes
A substitute is a good or service that can be used instead of another.
Examples include:
- Tesco and Sainsbury’s sandwiches.
- Bus travel and train travel on some routes.
- Netflix and Disney+ for some households.
- Butter and margarine.
If the price of a substitute rises, demand for the original product may increase. If the price of Netflix rises, some consumers may demand more Disney+ instead.
4. Price of complements
A complement is a good or service bought together with another good or service.
Examples include:
- Printers and ink cartridges.
- Games consoles and video games.
- Cars and petrol or electric charging.
- Cinema tickets and popcorn.
If the price of a complement rises, demand for the related product may fall. If petrol becomes much more expensive, demand for large petrol cars may decrease.
5. Population and demographics
Population means the number of people in a market. Demographics are the characteristics of a population, such as age, income, family size or location.
If the population grows, demand for many goods and services rises. In areas with more young families, demand for childcare, school places and children’s clothing may increase. In areas with more older people, demand for healthcare services may increase.
6. Expectations about the future
Consumers’ expectations can affect current demand.
If people expect prices to rise in the future, they may buy now. For example, if households expect rail fares or energy prices to rise, some may try to purchase tickets or fixed energy deals earlier.
If people expect unemployment to rise or their income to fall, they may reduce spending now and save more.
Explaining a change in demand
A UK supermarket notices that demand for own-label pasta has increased.
- Identify a possible factor: during a cost-of-living squeeze, many households have less spare income after paying for essentials.
- Link the factor to consumer behaviour: consumers may switch from premium branded pasta to cheaper own-label pasta.
- State the demand effect: demand for own-label pasta increases because more consumers are willing and able to buy it at each price.
Non-price factors shift demand
If something other than the product’s own price changes, the whole demand curve shifts.
Causes of changes in demand
A change in demand means the whole demand curve moves.
Increase in demand
An increase in demand means consumers want and can buy more at every price. The demand curve shifts to the right.
This could be caused by:
- Higher incomes for a normal good.
- Better advertising.
- A rise in the price of a substitute.
- A fall in the price of a complement.
- A favourable change in tastes.
- Population growth.
Decrease in demand
A decrease in demand means consumers want and can buy less at every price. The demand curve shifts to the left.
This could be caused by:
- Lower incomes for a normal good.
- Bad publicity.
- A fall in the price of a substitute.
- A rise in the price of a complement.
- A product becoming unfashionable.
- A shrinking target population.
Demand diagrams help you show these changes clearly.
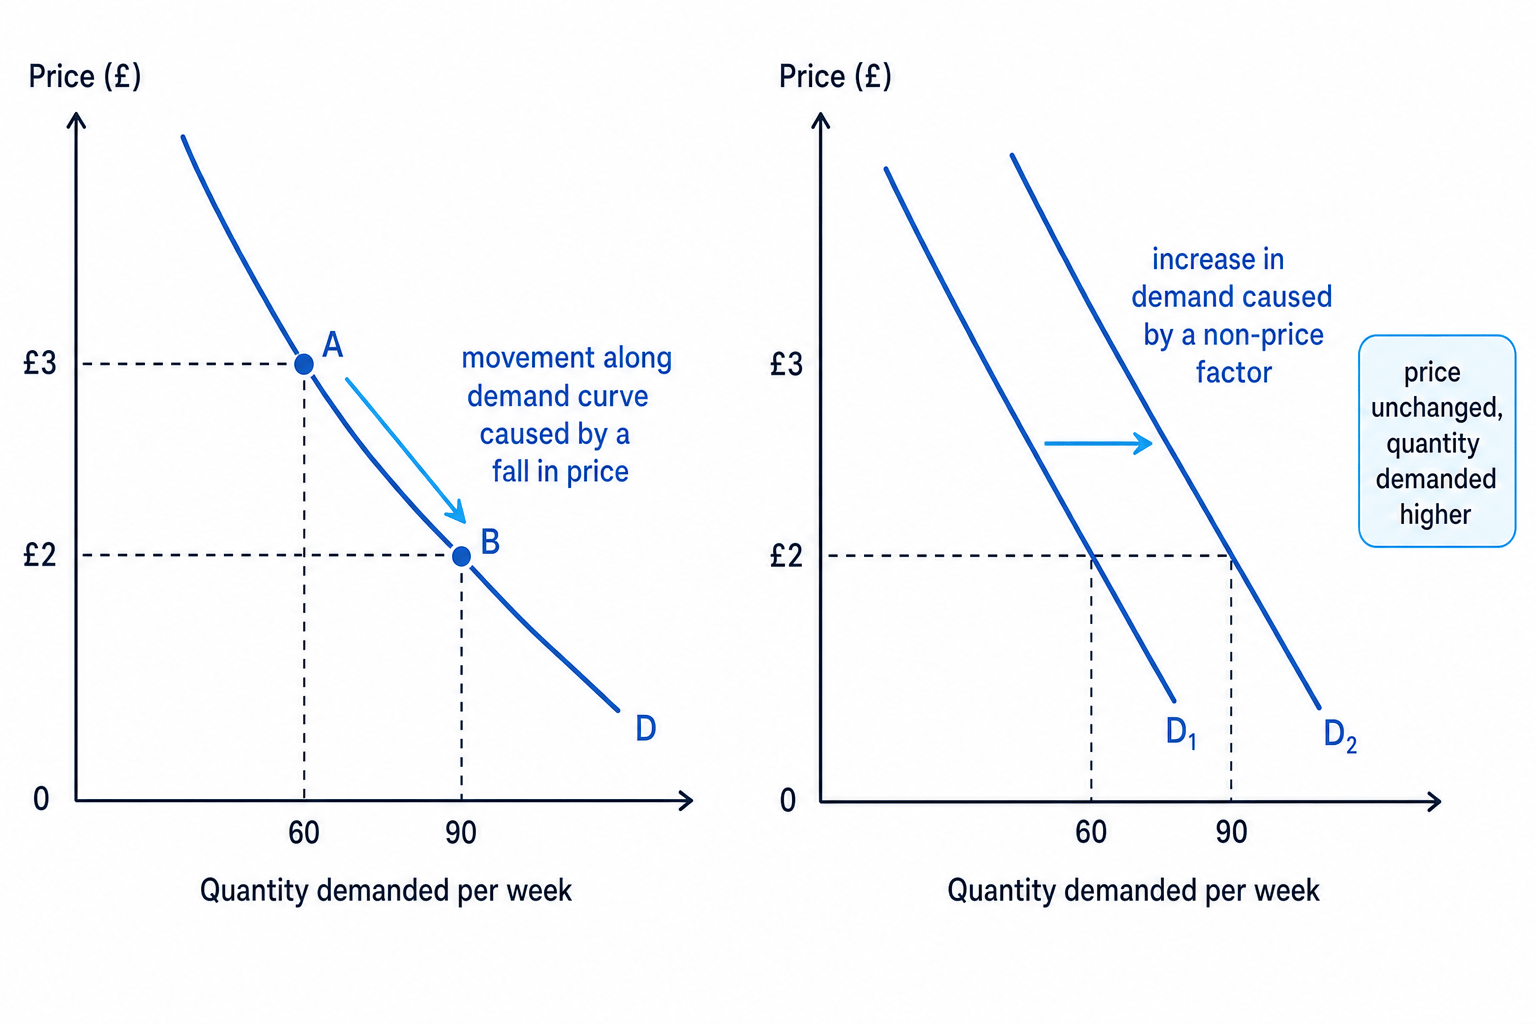
Movements along versus shifts of the demand curve
This is one of the most important distinctions in this topic.
Movement along the demand curve
A movement along the demand curve happens when the product’s own price changes.
- Price falls → extension of demand → quantity demanded rises.
- Price rises → contraction of demand → quantity demanded falls.
The curve itself does not move. You move from one point to another point on the same curve.
Shift of the demand curve
A shift of the demand curve happens when a non-price factor changes.
- Demand increases → curve shifts right.
- Demand decreases → curve shifts left.
The price of the product itself is not the cause of the shift.
Movement or shift
Decide whether each event causes a movement along the demand curve or a shift of the curve for cinema tickets.
- If the cinema cuts ticket prices from £12 to £8, this is a change in the product’s own price, so there is a movement along the demand curve.
- If a popular new Marvel film is released, tastes and preferences change, so the demand curve for cinema tickets may shift right.
- If Netflix becomes cheaper, a substitute for cinema trips becomes more attractive, so the demand curve for cinema tickets may shift left.
Shifting the curve when price changes
If the question says the price of the good itself changes, do not shift the demand curve. Show a movement along the existing curve.
Ethical and sustainability links
Demand is not just about price. Consumers’ choices can affect producers, workers, society and the environment.
For example, rising demand for fast fashion may benefit clothing retailers and give consumers cheap choice, but it can raise concerns about waste, carbon emissions and working conditions in global supply chains.
Rising demand for Fairtrade chocolate, plant-based foods or second-hand clothing may encourage firms to produce in more ethical or sustainable ways. However, these products may be more expensive, so not all consumers can afford to choose them.
Consumers send signals
When demand rises or falls, consumers are sending signals to producers about what to make more or less of.
Bringing it together
For this section, your core chain of reasoning is:
- A consumer is willing and able to buy a quantity at a price.
- The demand curve shows the relationship between price and quantity demanded.
- A change in the good’s own price causes a movement along the curve.
- A change in a non-price factor causes the whole curve to shift.
In the exam
- Use the word because: “Demand increases because incomes rise, so consumers are willing and able to buy more at each price.”
- Check whether the cause is the product’s own price or a non-price factor before deciding movement or shift.
- In diagrams, label both axes, the demand curve, and any shift direction clearly.
Check yourself
- What does “willing and able to buy” add to the definition of demand?
- Why might demand for own-label groceries rise during a cost-of-living squeeze?
- What is the difference between a movement along a demand curve and a shift of the curve?
