Price moves until demand and supply match again
- Equilibrium: the price at which quantity demanded equals quantity supplied.
- A shift in demand or supply creates a shortage or surplus at the old equilibrium price.
- Shortage: quantity demanded is greater than quantity supplied, so price tends to rise.
- Surplus: quantity supplied is greater than quantity demanded, so price tends to fall.
- Price changes until quantity demanded and quantity supplied are equal again at the new equilibrium.
- Read the new price and quantity from the new crossing point of the two curves.
- If demand shifts, price and quantity move in the same direction; if supply shifts, they move in opposite directions.
- A demand increase raises equilibrium price and quantity; a demand decrease lowers both.
- A supply increase lowers price and raises quantity; a supply decrease raises price and lowers quantity.
Case study
- Four changes, four markets: shift one curve and read the new price and quantity from the new crossing point.
| Change | Curve | Price | Quantity | UK example |
|---|---|---|---|---|
| Demand rises | Right | Rises | Rises | Ice cream |
| Demand falls | Left | Falls | Falls | Gas |
| Supply rises | Right | Falls | Rises | Wheat harvest |
| Supply falls | Left | Rises | Falls | Nissan Sunderland |
- Examples of the triggers: a heatwave increases demand for ice cream; a mild winter reduces demand for gas; a good harvest increases wheat supply; a chip shortage reduces car supply.
- Demand shifts move price and quantity together. Supply shifts move them in opposite directions.
- For example, a supply fall in cars can raise price while reducing the number sold.
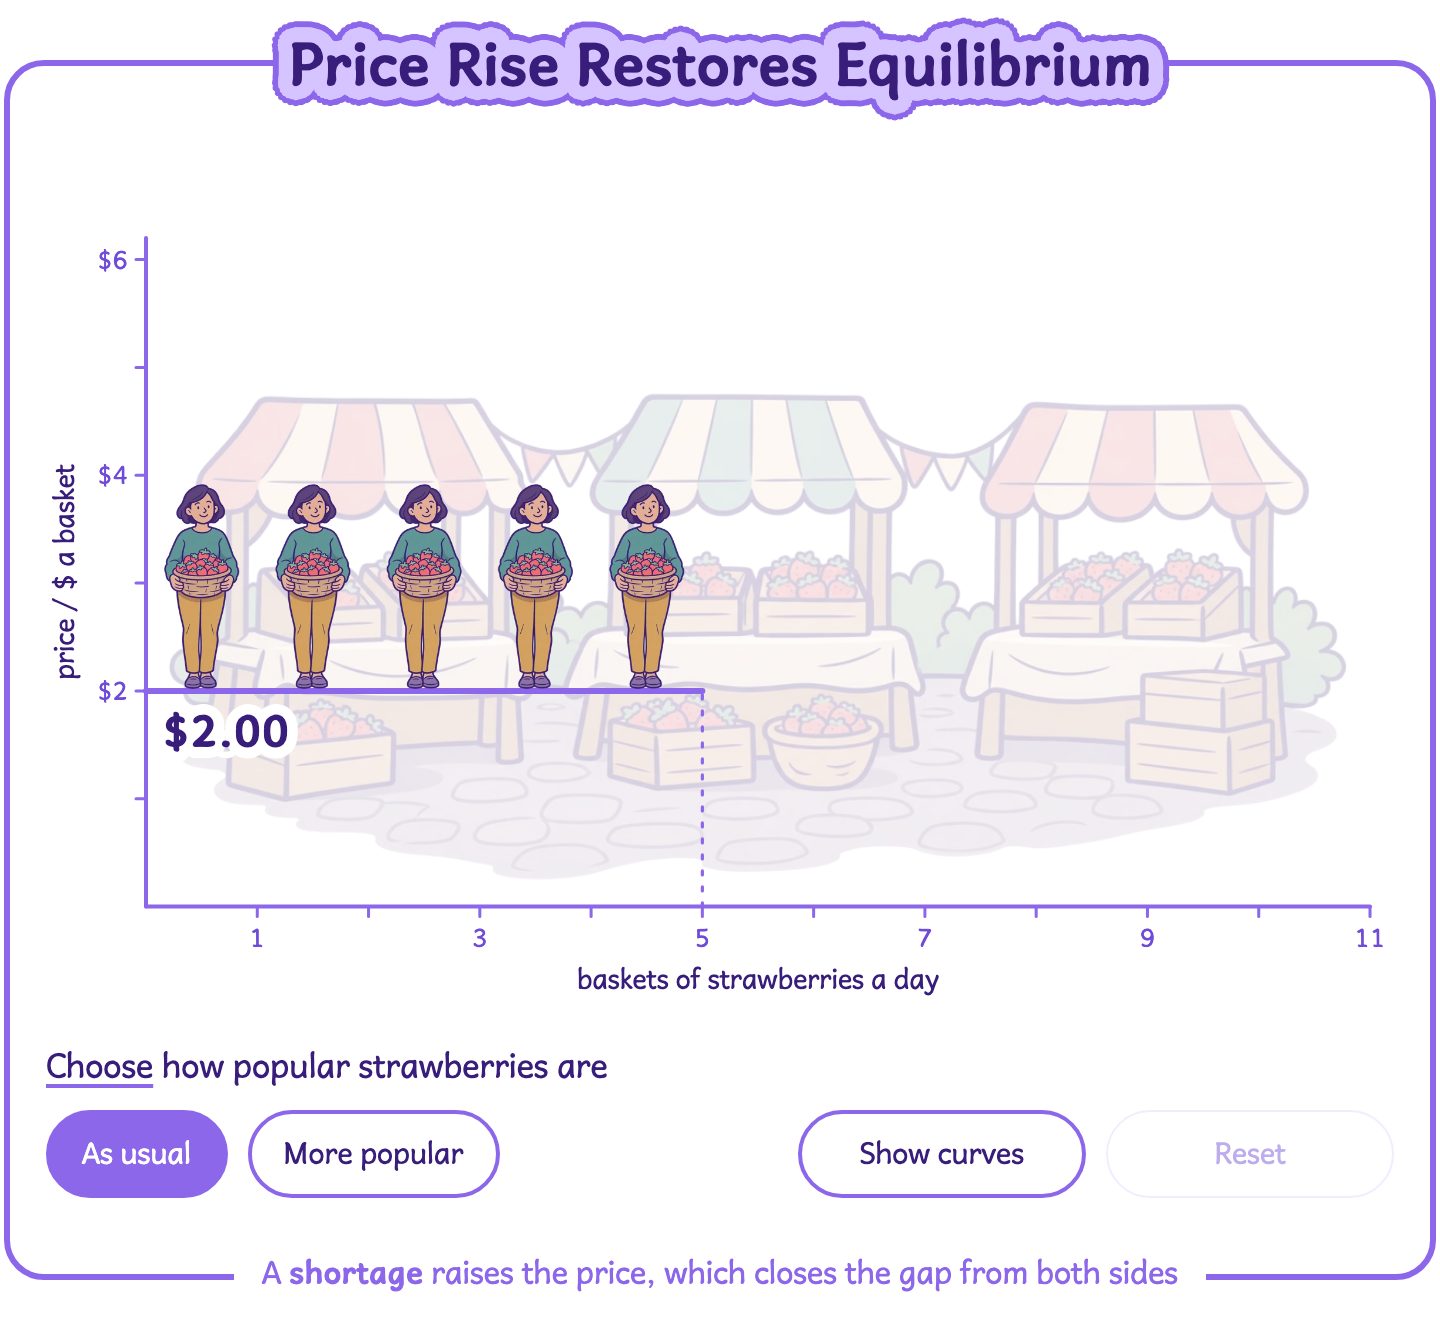
Shift demand to create a shortage and watch the rising price bring demand and supply back together.
The same curves fit any market
- Any market: the same demand-and-supply reasoning applies wherever buyers and sellers respond to price.
- Before using the model, identify the buyers, sellers and unit traded.
- For electricity, buyers are households and firms; sellers are generators and suppliers; the unit is a kilowatt hour.
- For rented flats, buyers are tenants; sellers are landlords; the unit is a tenancy for a stated period.
- The model applies to services as well as goods, such as haircuts, train journeys and plumbers’ hours.
- Markets differ in how quickly supply can adjust, but the direction of the equilibrium change is found in the same way.
- In the short run, a fixed supply, for example, seats at a sold-out concert, can make the price response much larger.
Common Mistake
- Shift one curve only unless the question gives a reason for both to shift.
- A change in the good’s own price causes a movement along a curve, not a shift.
- Keep and label the old and new equilibrium when comparing diagrams.
Revenue is the rectangle under equilibrium
Definition
Total revenue: the money a producer receives from selling output. It is calculated as total revenue = price × quantity sold.
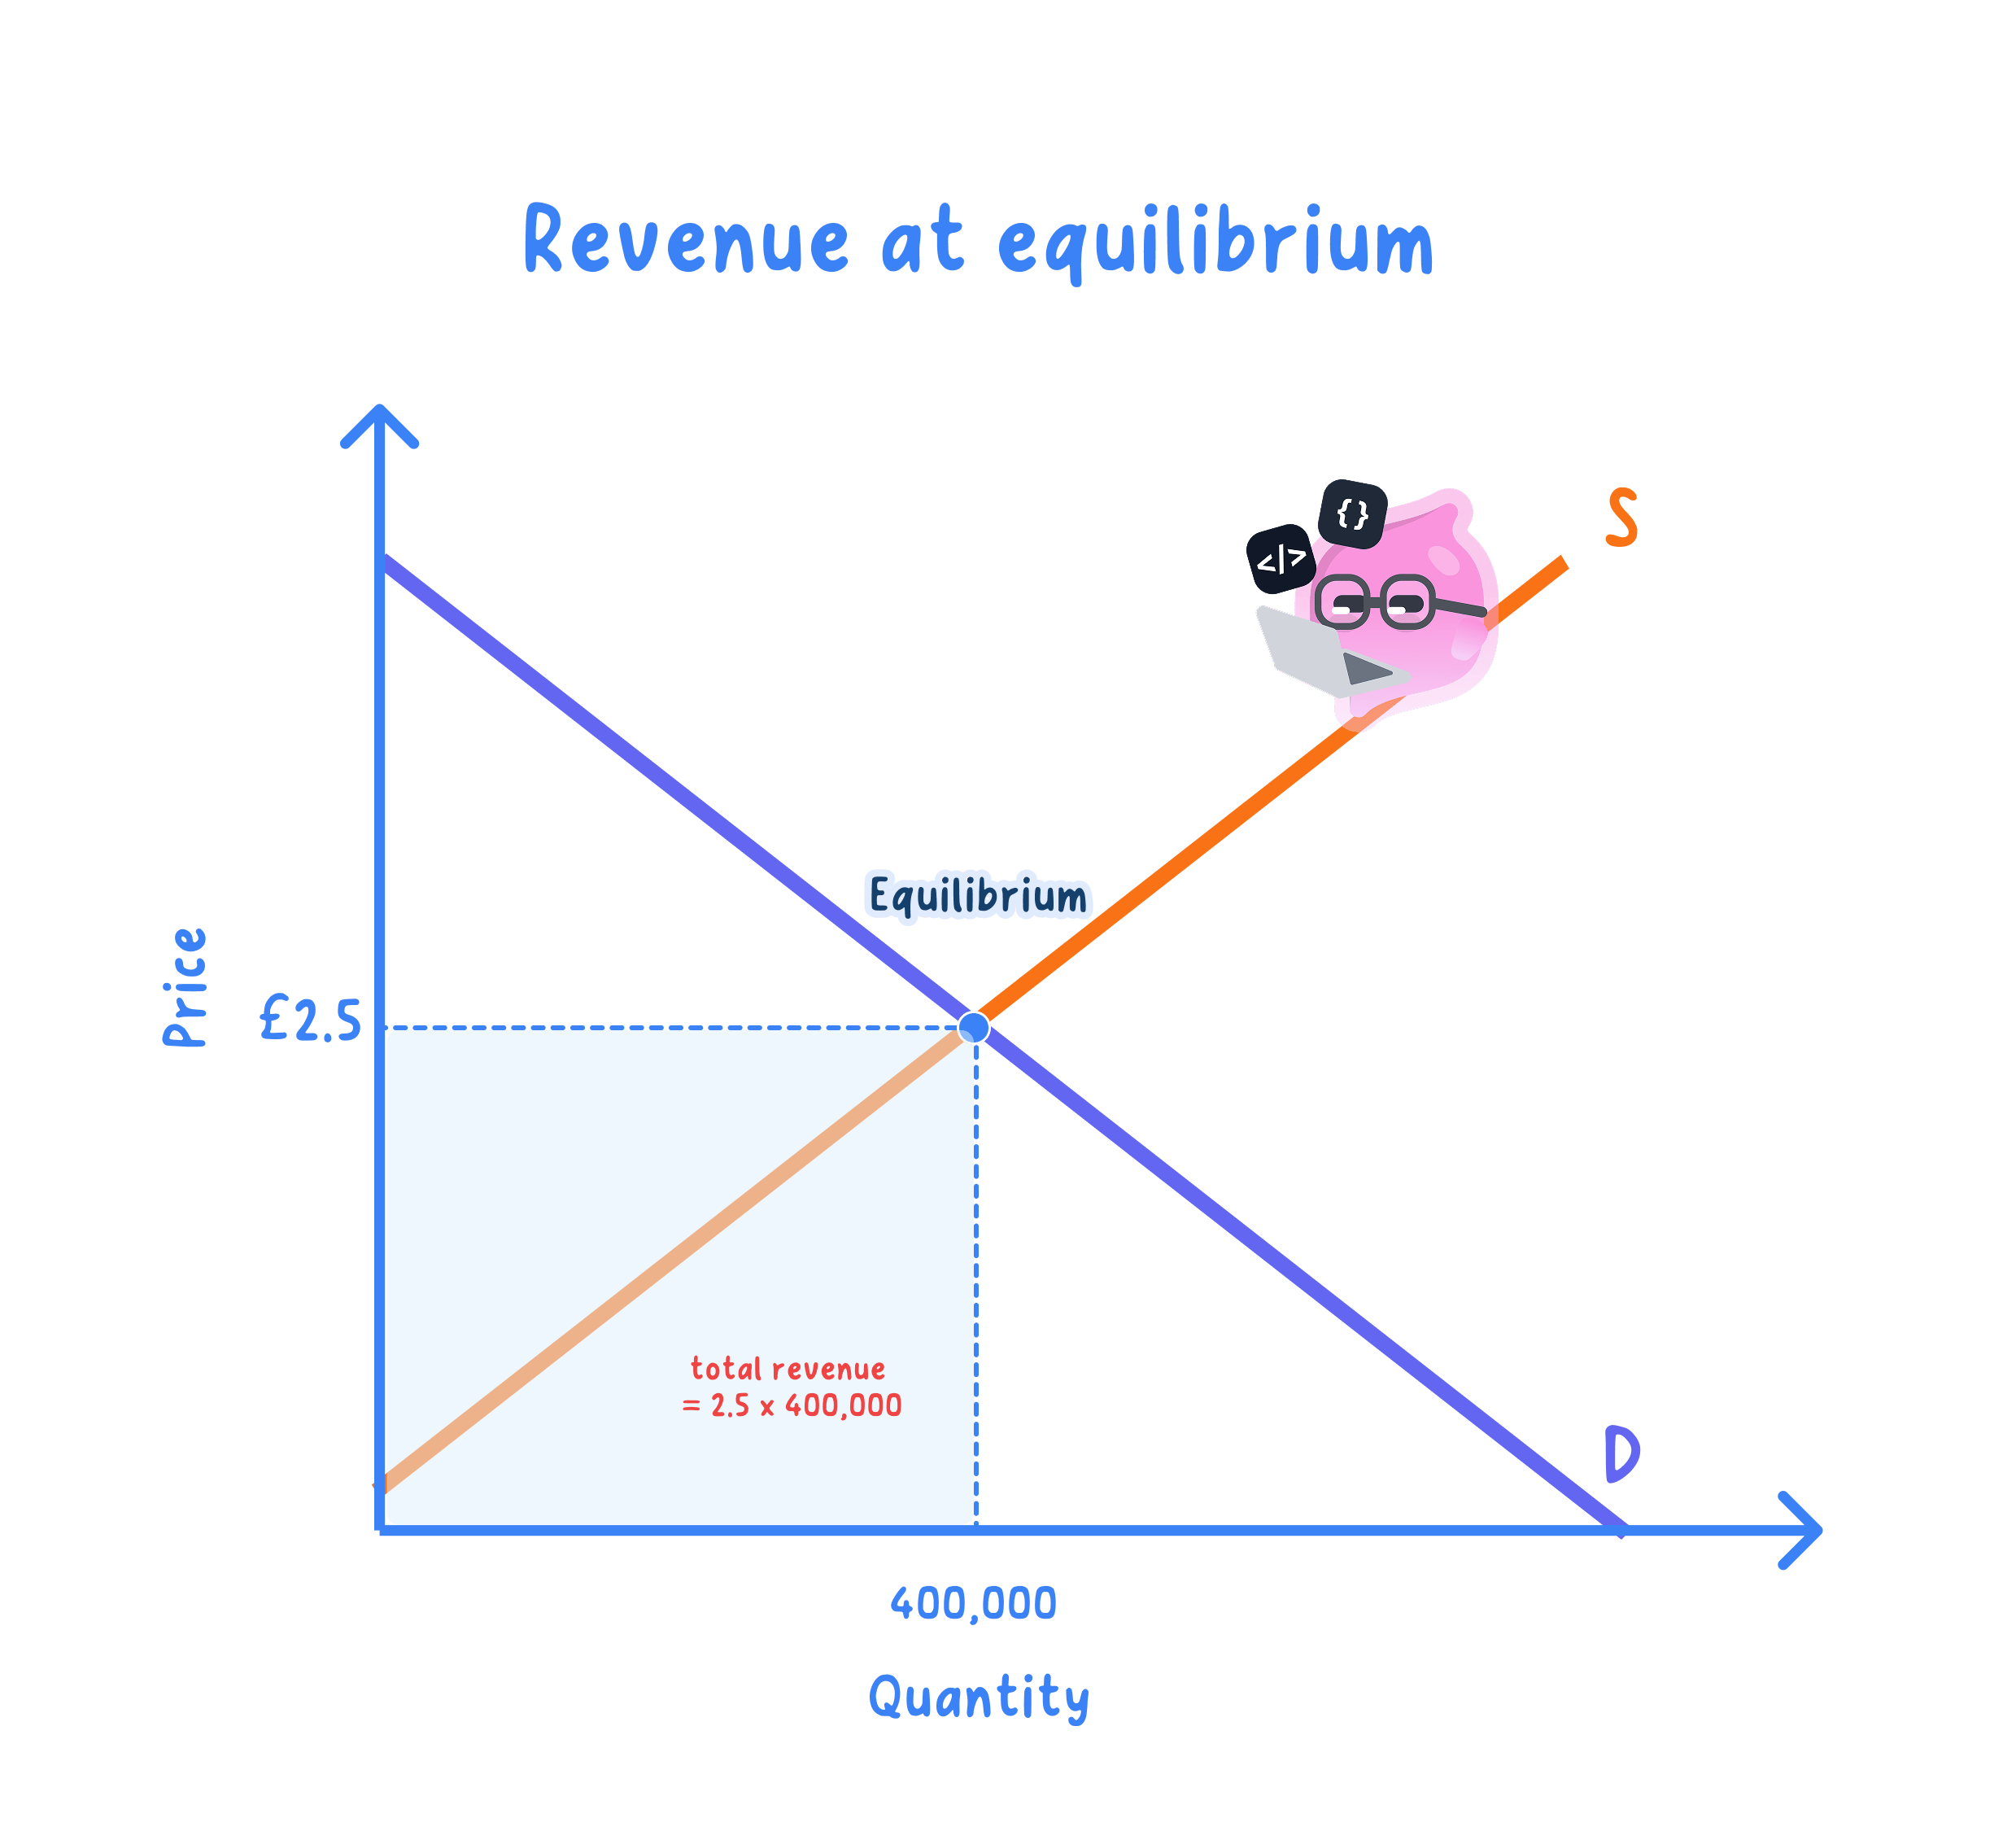
- On a demand-and-supply diagram, total revenue is shown by the rectangle from the origin to the equilibrium point.
- The rectangle’s height is the equilibrium price and its width is the equilibrium quantity.
- When equilibrium changes, both the height and width of the revenue rectangle may change.
- After a demand shift, price and quantity move in the same direction, so total revenue moves in that direction too.
- After a supply shift, price and quantity move in opposite directions, so calculate price × quantity rather than guessing.
Example
- The UK market for British strawberries: initially, strawberries sell for £2.50 and 400,000 punnets are sold each week.
- The first diagram shows this £1,000,000 as the revenue rectangle at the original equilibrium.
- A warm spring produces a heavy crop. Supply shifts right, price falls to £2.00 and quantity sold rises to 550,000 punnets.
- The rectangle becomes shorter but wider; quantity rises enough to make total revenue £100,000 higher.
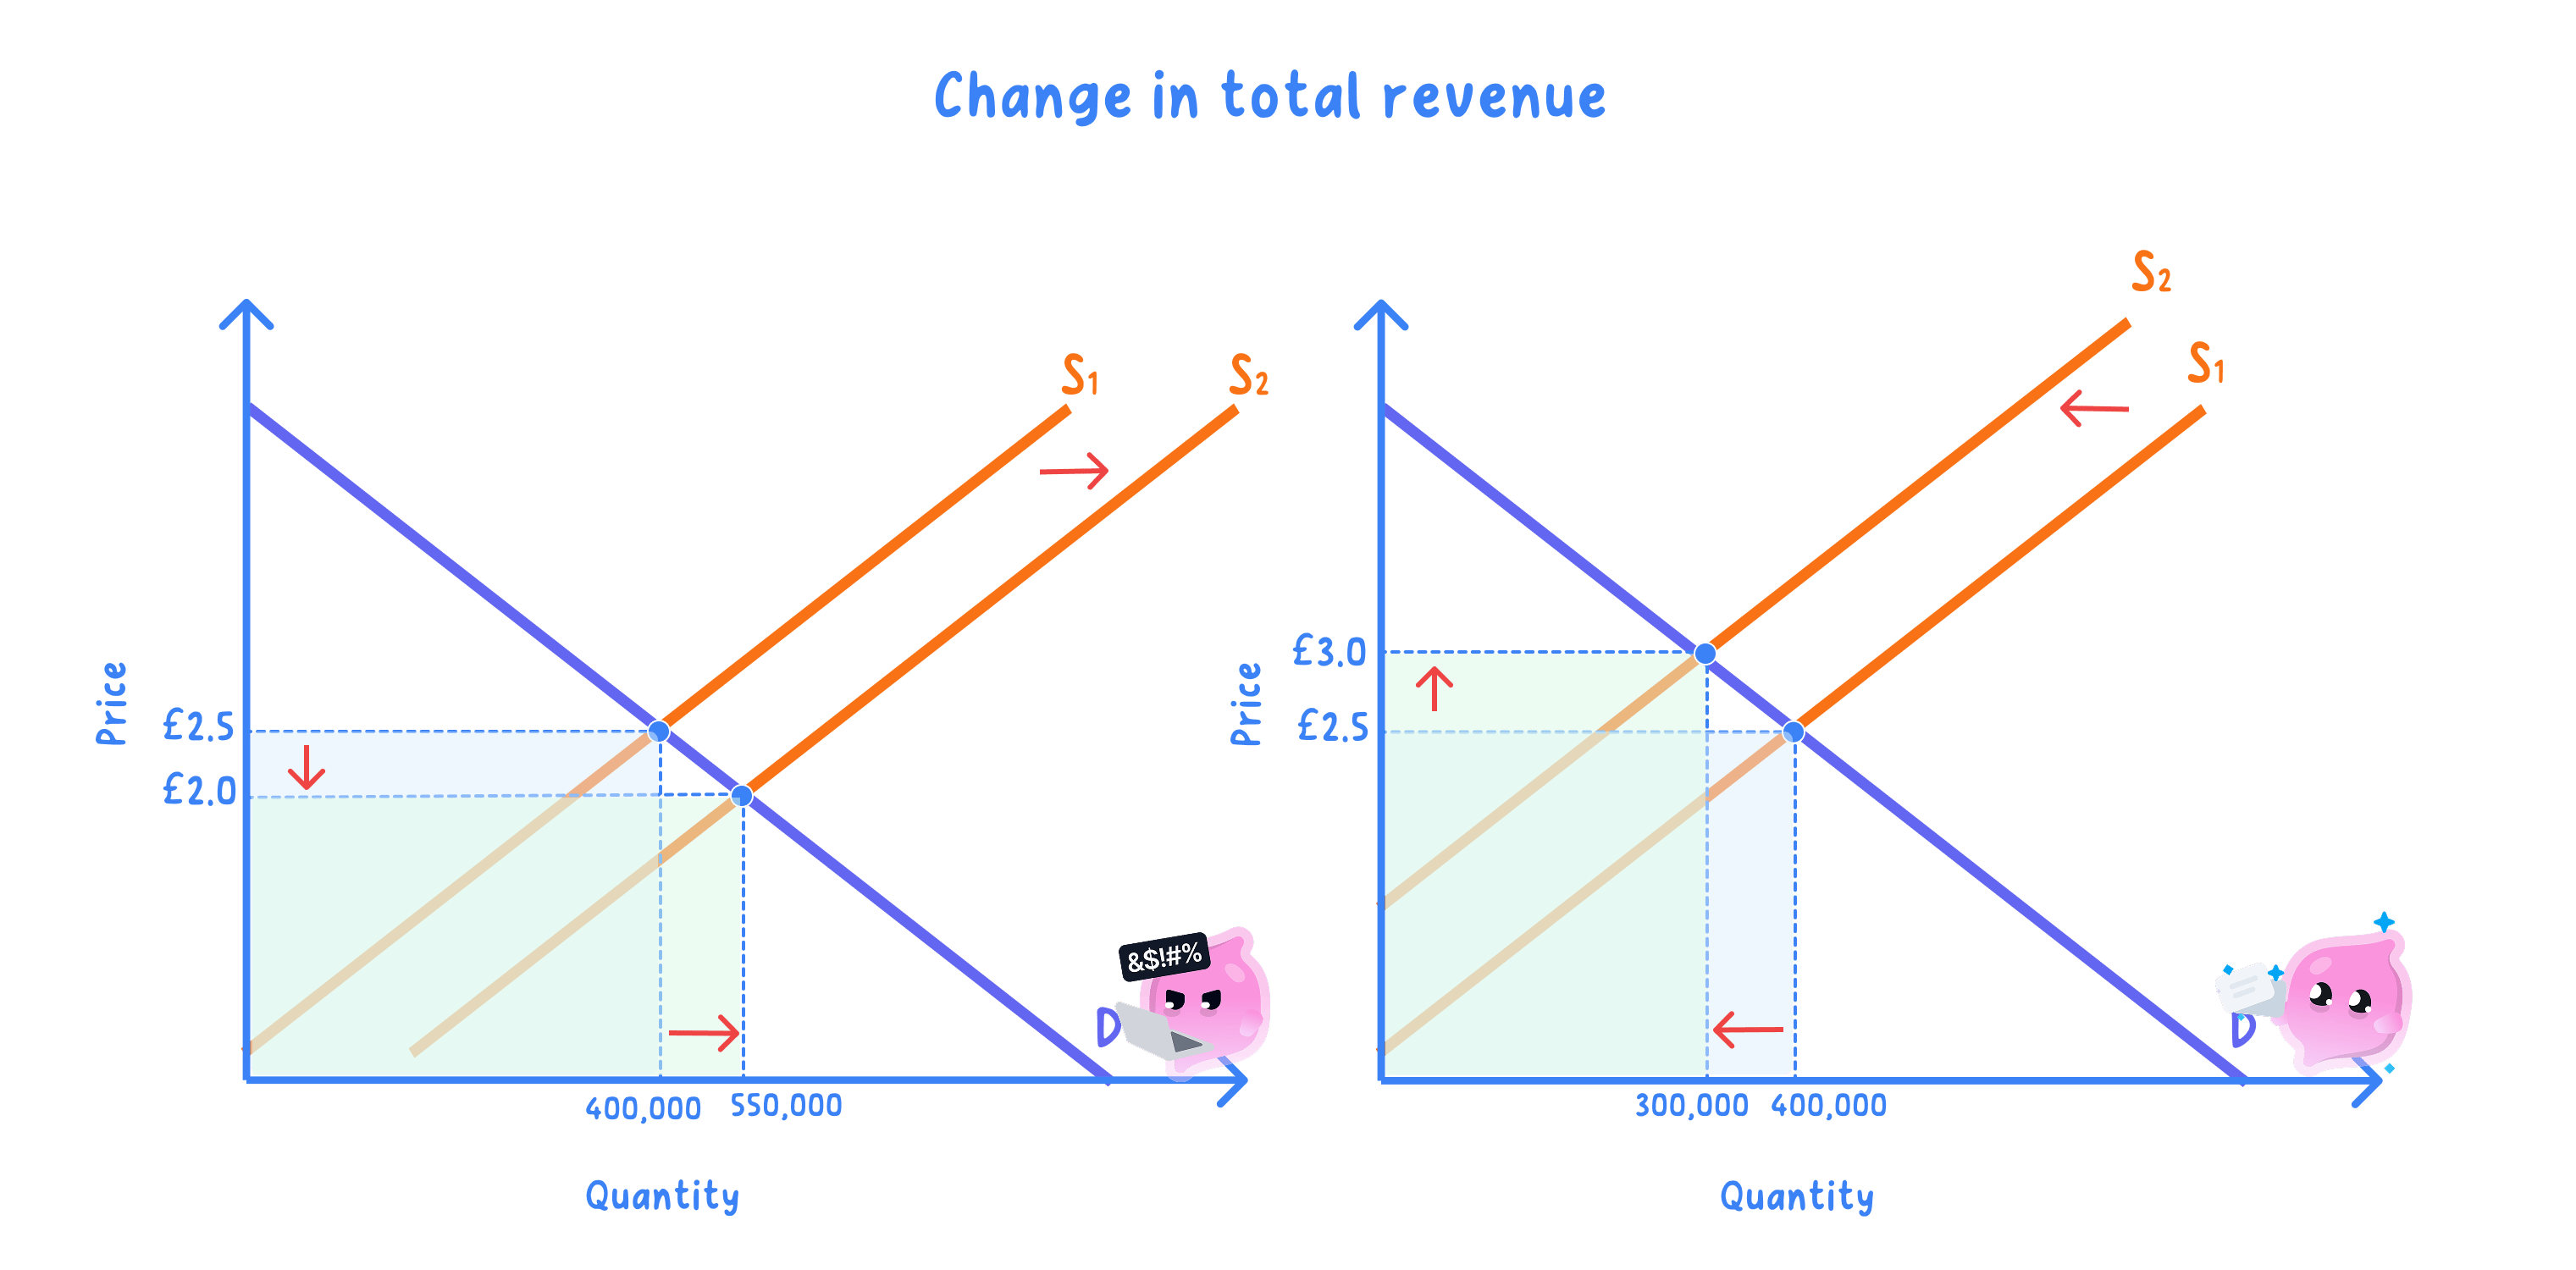
- If a frost shifts supply left instead, price rises to £3.00 and quantity falls to 300,000 punnets.
- Here the rectangle is taller but much narrower, so revenue falls. This is why a supply change must be calculated, not guessed.
Revenue is not the same as profit
- Revenue is the money received from sales before any costs are deducted.
- Profit is revenue minus costs.
- A rise in revenue does not necessarily mean a rise in profit, because costs may also have changed.
Exam technique
- Calculate price × quantity for each equilibrium on separate lines.
- Then subtract and state whether total revenue rose or fell.
- Write revenue, not profit, unless the question gives costs.
Self review
- How do you find the new equilibrium after a curve shifts?
- What happens to equilibrium price and quantity when supply increases?
- Which curve shifts when a mild winter reduces demand for gas?
- Which area on a demand-and-supply diagram represents total revenue?
- At £2.50 and 400,000 punnets, what is total revenue?