Question 20
FThe bar chart shows the mass of sulfur dioxide and the mass of oxides of nitrogen emitted in one country in three different years.
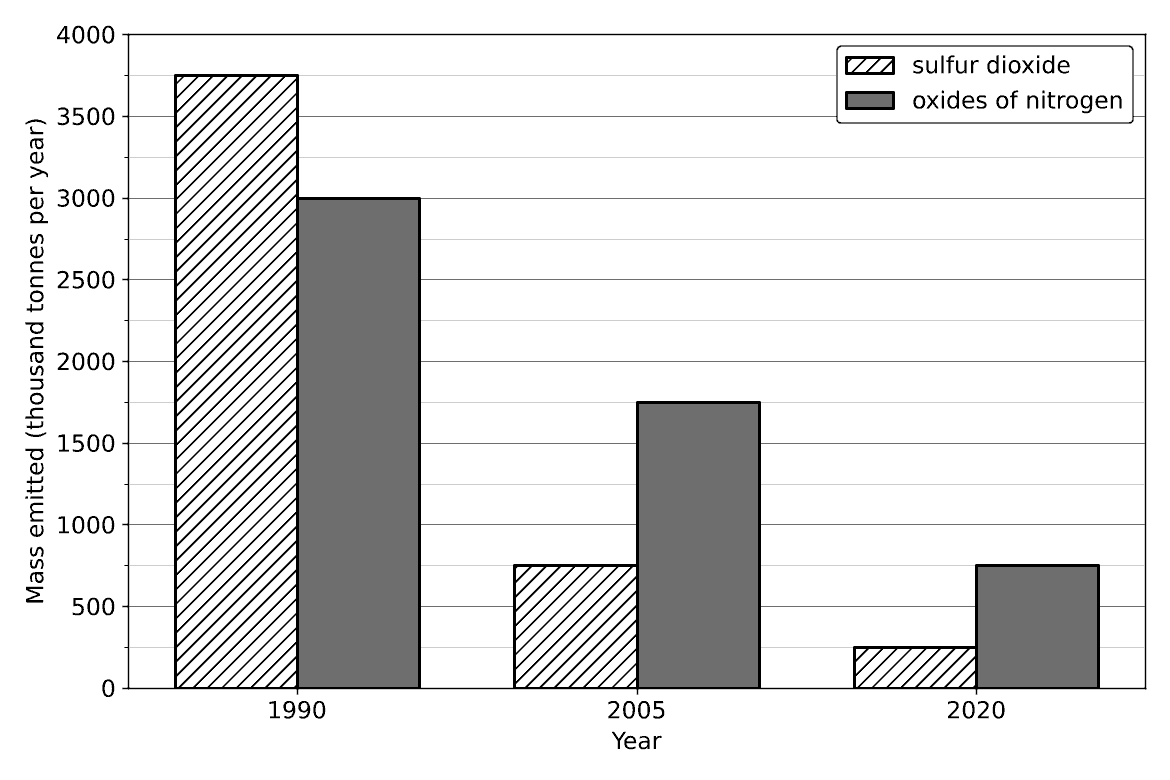
Statement 1: Between 1990 and 2020, emissions of sulfur dioxide fell by more than 90%.
Statement 2: In 2020, the mass of oxides of nitrogen emitted was three times the mass of sulfur dioxide emitted.
Statement 3: Between 1990 and 2005, emissions of oxides of nitrogen fell by a greater percentage than emissions of sulfur dioxide.
Which statements are correct?
1 only
1 and 2 only
2 and 3 only
1, 2 and 3
6.3 Interpreting and interacting with earth systems Questions
51 exam-style questions on OCR GCSE Chemistry 6.3 Interpreting and interacting with earth systems, covering 6.3.1 Formation and evolution of the atmosphere, 6.3.2 The greenhouse effect and climate change, 6.3.3 Sources and problems of atmospheric pollutants, and 6.3.4 Producing potable water. Each one has a worked solution and a mark scheme showing where the marks go.