Question 14
FThe graph shows the mean concentration of carbon dioxide in the atmosphere, measured at an observatory.
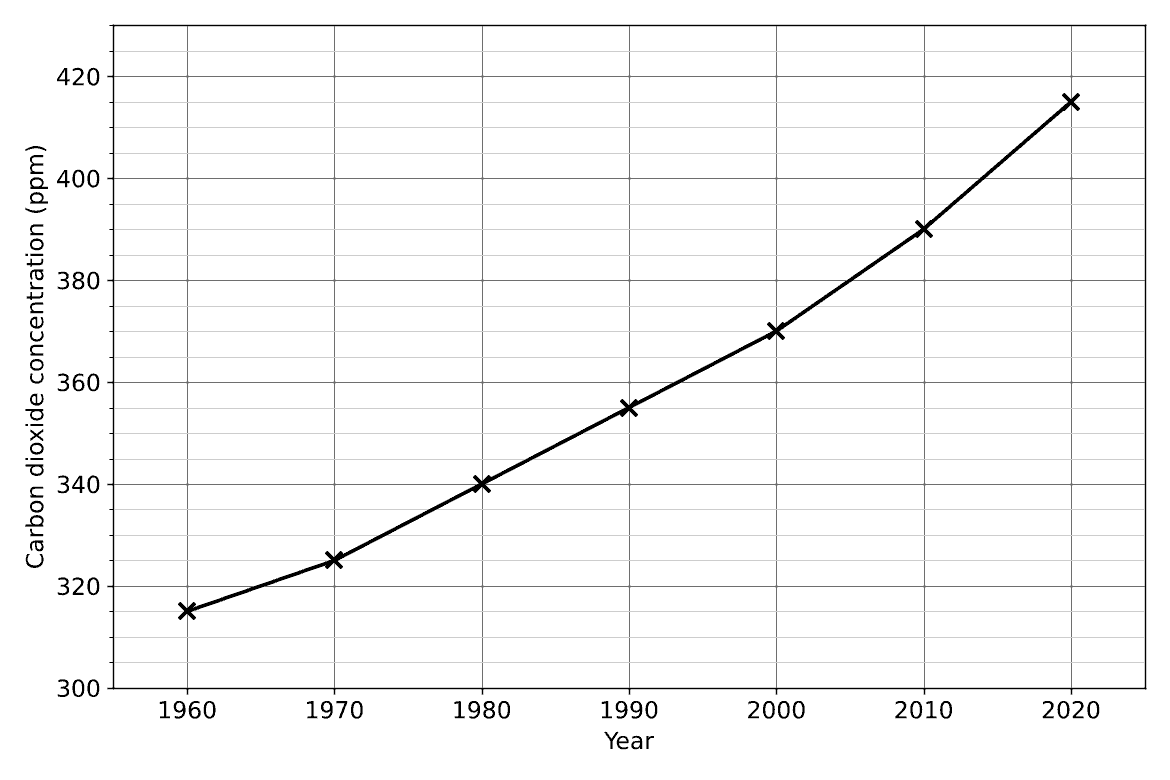
Which statement is supported by the graph?
The concentration increased by about 100% between 1960 and 2020.
The concentration increased at a constant rate between 1960 and 2020.
The mean rate of increase between 2010 and 2020 was about 2.5 times the mean rate of increase between 1960 and 1970.
If the concentration keeps rising at its 2010 to 2020 rate, it will reach 500 ppm by 2030.
6.3 Interpreting and interacting with earth systems Questions
51 exam-style questions on OCR GCSE Chemistry 6.3 Interpreting and interacting with earth systems, covering 6.3.1 Formation and evolution of the atmosphere, 6.3.2 The greenhouse effect and climate change, 6.3.3 Sources and problems of atmospheric pollutants, and 6.3.4 Producing potable water. Each one has a worked solution and a mark scheme showing where the marks go.