Question 9
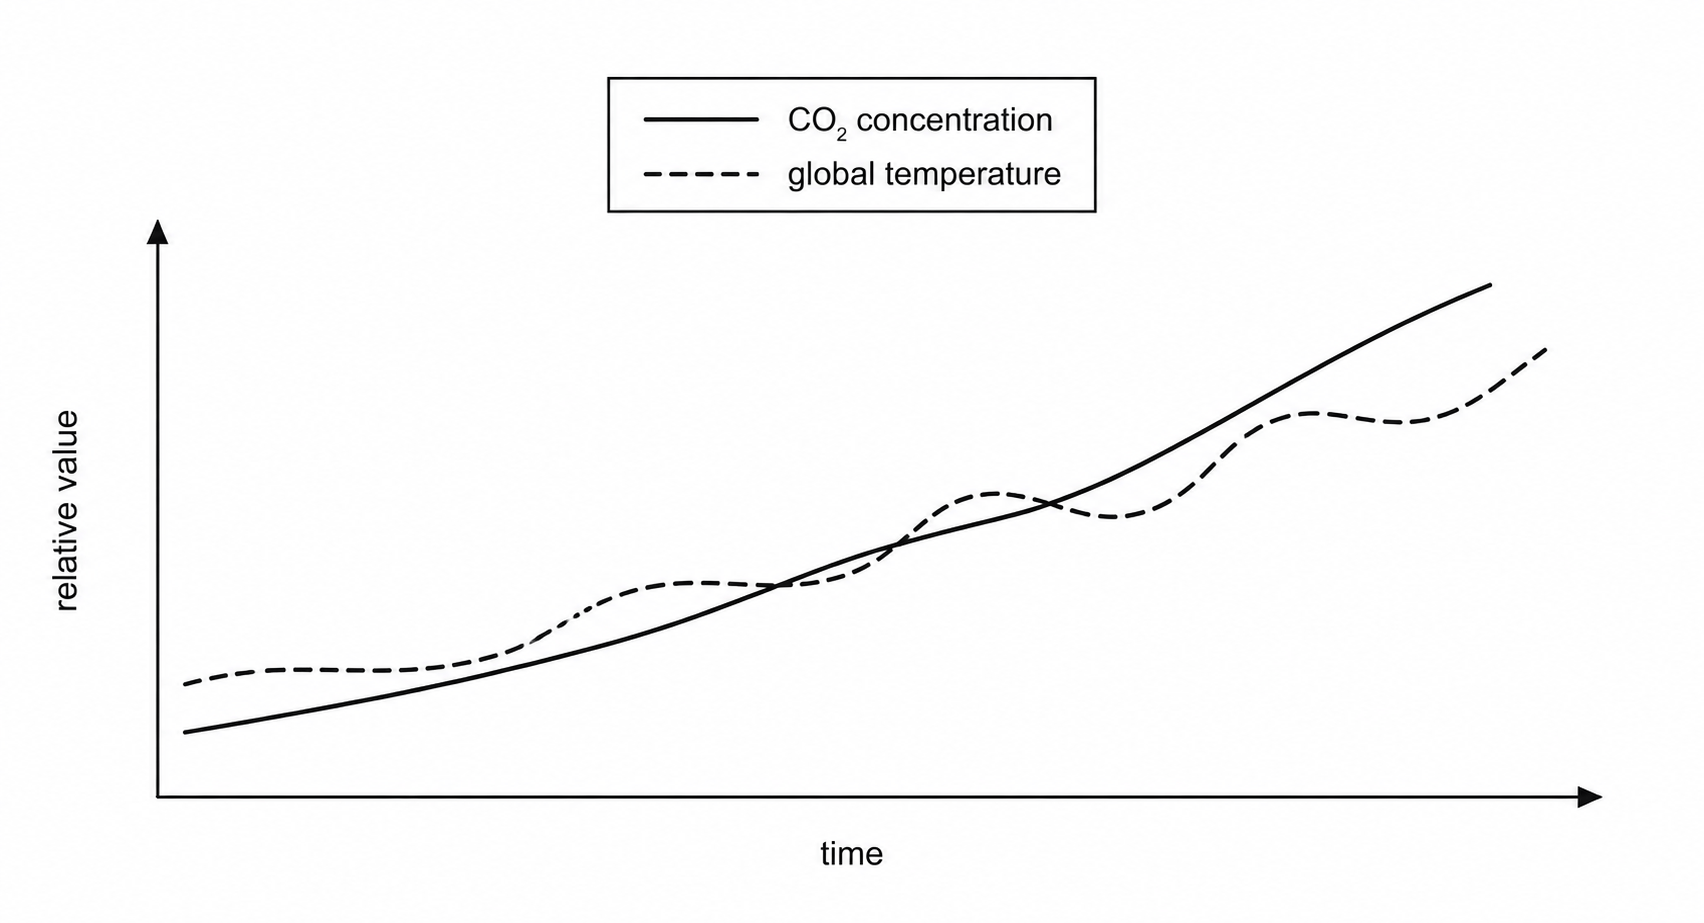
FThe graph compares the long-term patterns of atmospheric carbon dioxide and global temperature.
a.[3]
Use the solid and dashed lines to describe one long-term similarity and one shorter-term difference.
Explain why the crossing points do not mean that temperature and carbon dioxide concentration have become equal.
b.[3]
Explain how an increase in atmospheric carbon dioxide can affect Earth's temperature. Refer to radiation emitted by Earth's surface.
c.[2]
A pupil says that a short downward section of the temperature line disproves a long-term warming trend.
Evaluate this statement using the graph and state one additional kind of evidence needed to assess a real-world warming trend.
9.2 Earth and atmospheric science Questions
35 exam-style questions on Edexcel GCSE Chemistry 9.2 Earth and atmospheric science, covering 9.2.1 The Earth's early atmosphere, 9.2.2 How the atmosphere evolved, 9.2.3 Chemical test for oxygen, and 9.2.4 The greenhouse effect and climate change. Each one has a worked solution and a mark scheme showing where the marks go.