Question 18
HThe diagram illustrates dividing a fixed volume of material into smaller particles. It is schematic: the drawn number of pieces is not a quantitative three-dimensional model.
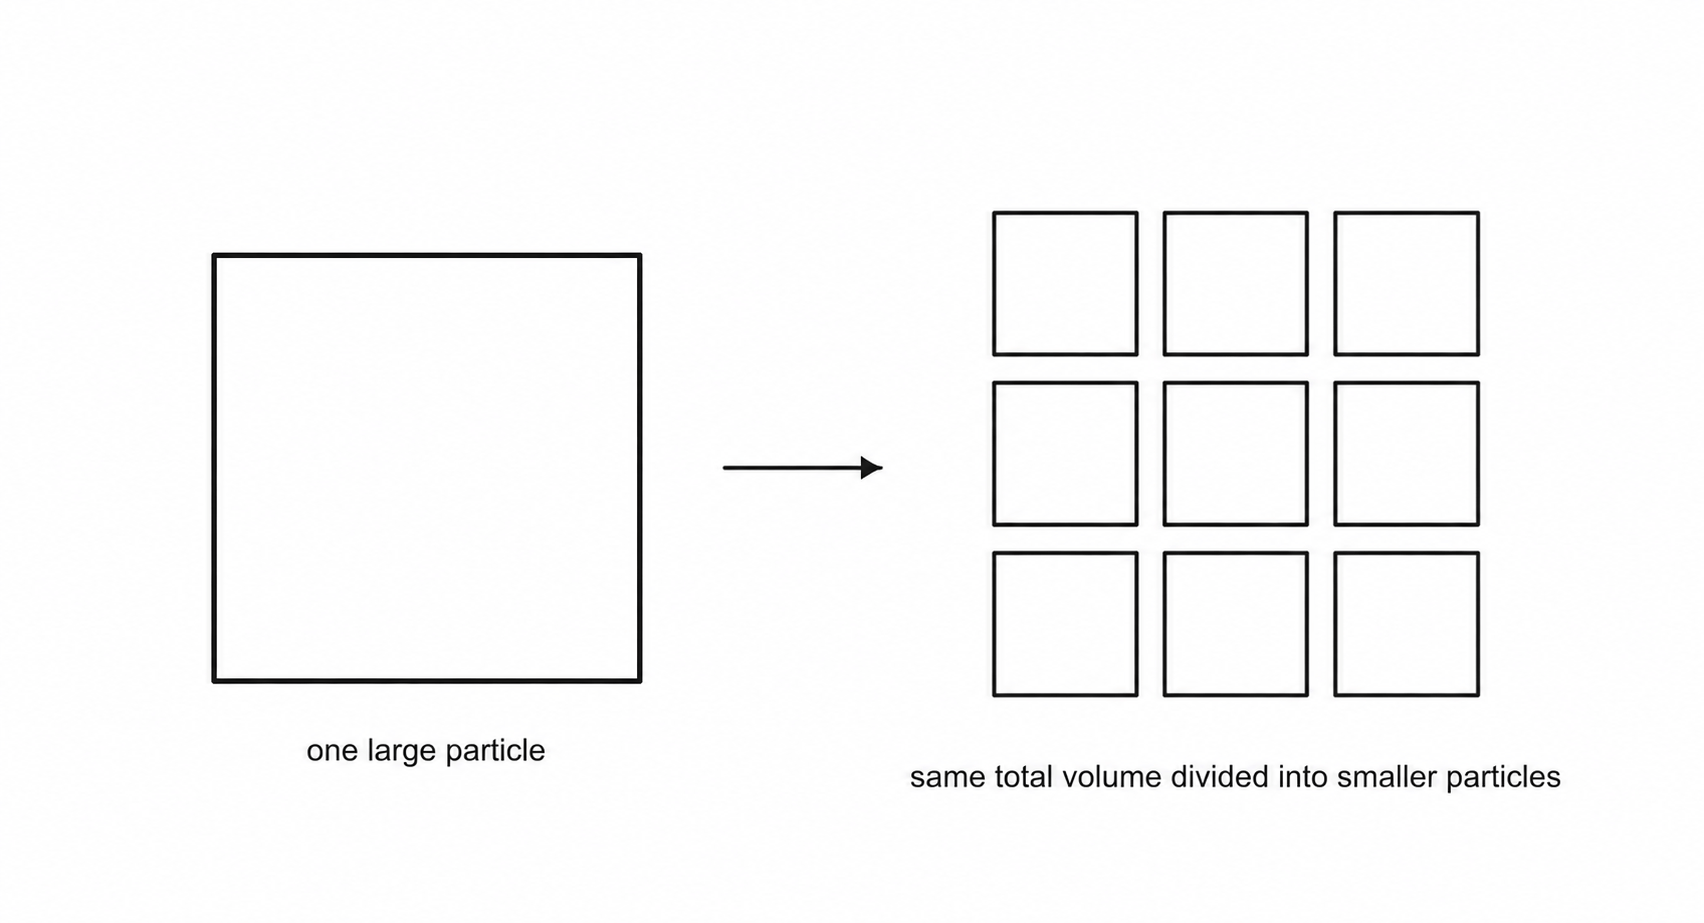
A manufacturer compares equal masses of the same catalyst as larger particles and as nanoparticles. The accessible surface areas are 2.4 m2 and 72 m2 respectively.
Assume initial reaction rate is proportional to accessible catalyst surface area under these particular conditions.
a.[2]
Use the diagram to explain why total surface area can increase although the total volume and mass stay unchanged.
b.[3]
Calculate the mass of nanoparticles expected to give the same accessible surface area as 15.0 g of the larger particles, assuming surface area is proportional to mass within each sample type.
c.[3]
The manufacturer claims that using less catalyst proves the nanoparticle process is safer. Evaluate this claim, referring to one possible benefit, one possible risk and evidence needed before a decision is made.
10.5 Bulk and surface properties of matter including nanoparticles Questions
36 exam-style questions on Edexcel GCSE Chemistry 10.5 Bulk and surface properties of matter including nanoparticles, covering 10.5.1 Nanoparticles: size, uses and risks and 10.5.2 Comparing and selecting materials. Each one has a worked solution and a mark scheme showing where the marks go.