A rate graph plots the amount of product or reactant against time
Definition
Rate of reaction
The change in the quantity of a reactant used or a product formed per unit time.
- Plot the quantity measured, such as gas volume, on the vertical axis and time on the horizontal axis.
- The line is steepest at the start, because the reaction is fastest when the most reactant is present.
- The line gradually becomes less steep as the reactants are used up.
- The line becomes flat when the reaction has finished and no more product forms.
- A reaction that finishes sooner, with a steeper line, is the faster reaction.
Key Idea
- The steeper the line, the faster the reaction at that moment.
- A flat line means the reaction has stopped.
The gradient of the line gives the rate at that time
Definition
Gradient
The change in the vertical-axis value divided by the corresponding change in the horizontal-axis value.
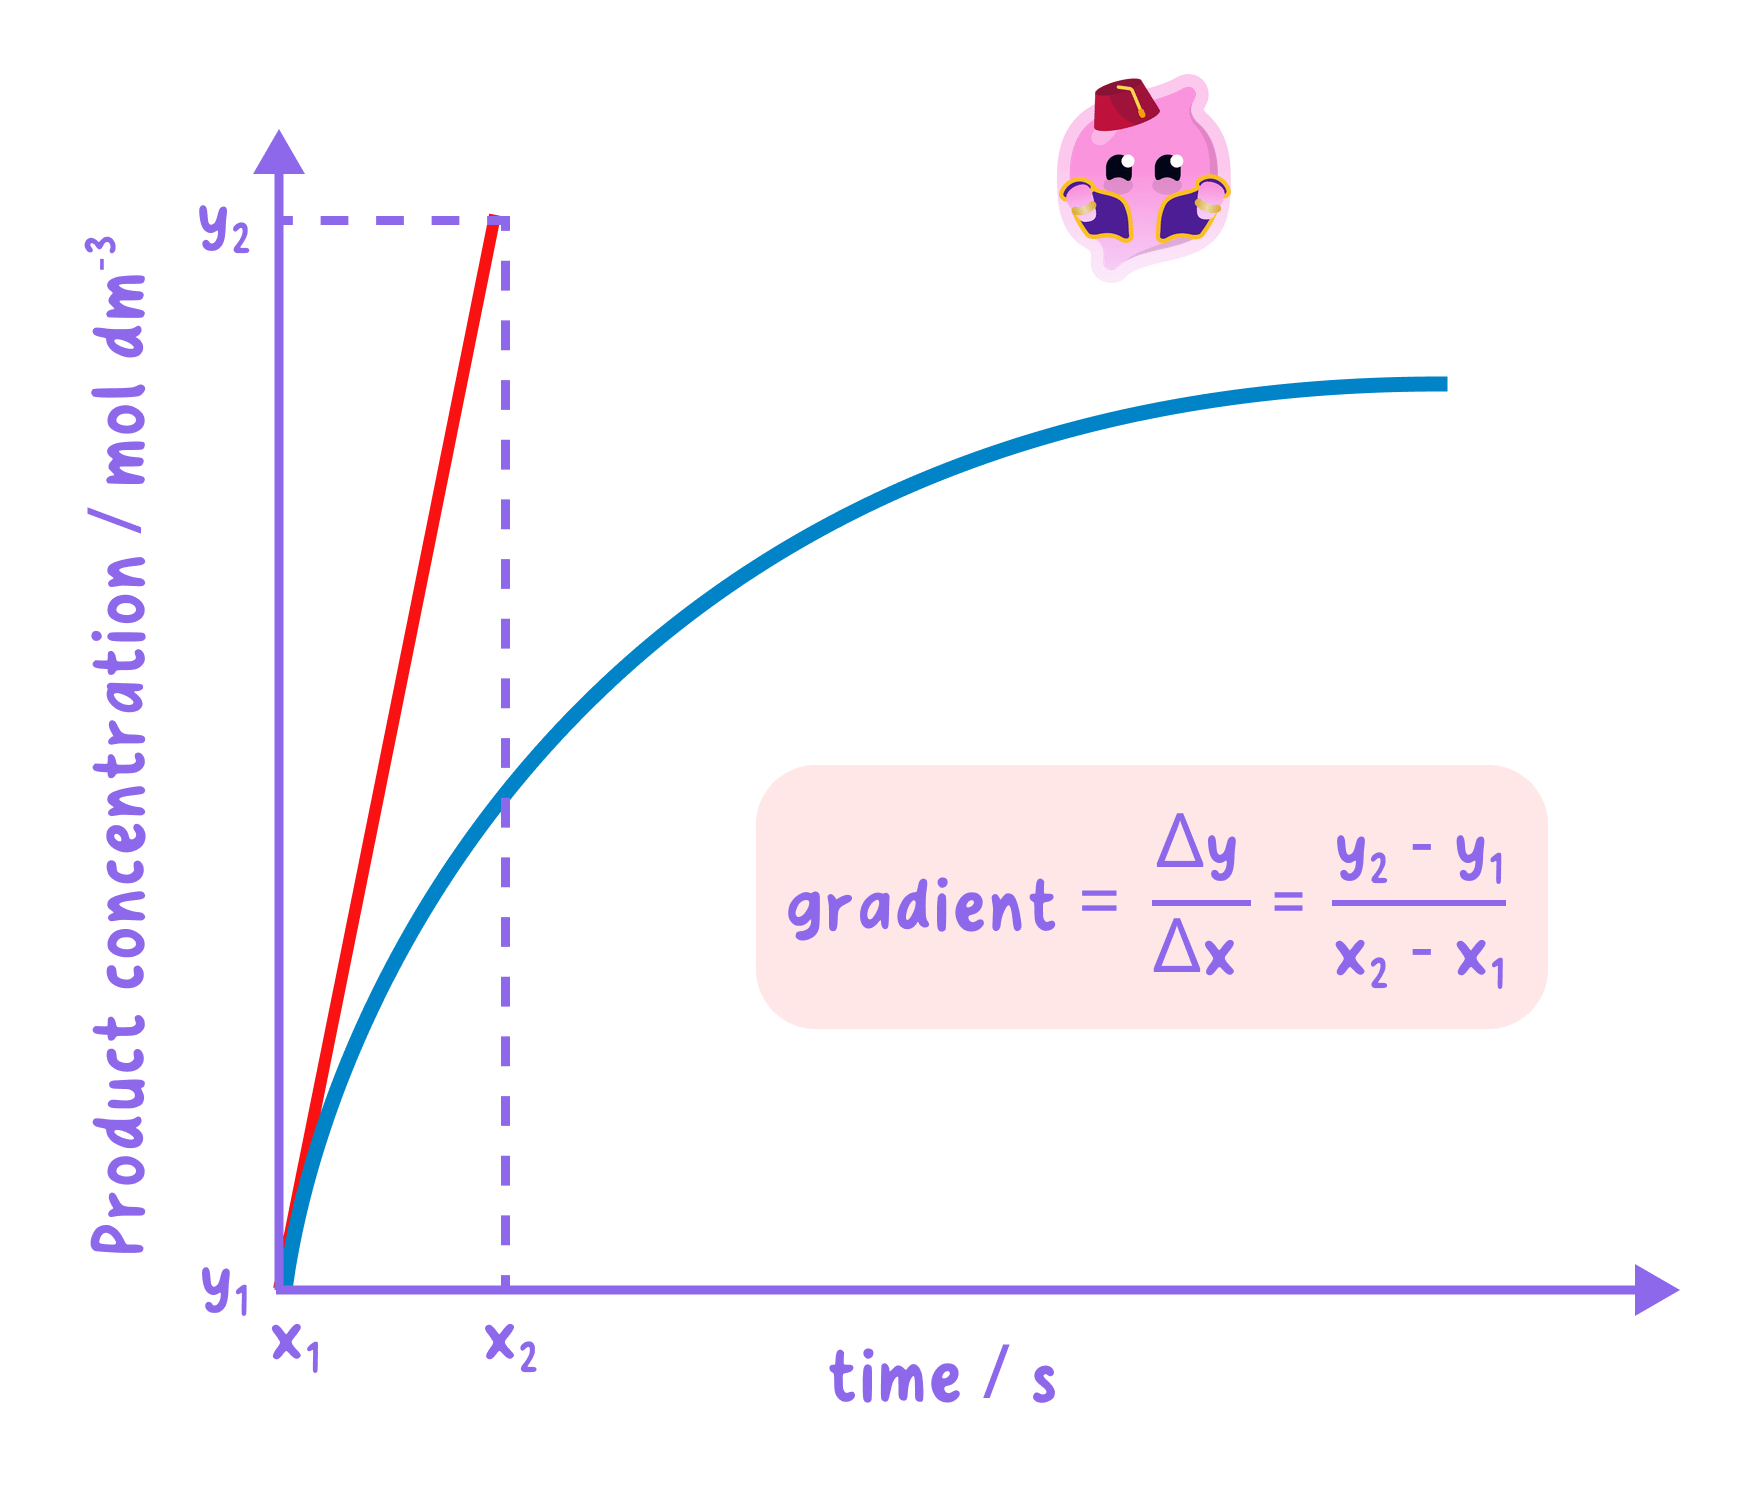
- The gradient is the change on the vertical axis divided by the change on the horizontal axis.
- A steeper gradient means a faster rate.
- For a straight part of the line, pick two points and divide the change in quantity by the change in time.
For a curve, draw a tangent and use its gradient
Definition
Tangent
A straight line drawn at a chosen point on a curve with the same gradient as the curve at that point.
- On a curve the rate is always changing, so you cannot read it from the curve directly.
- Draw a tangent that just touches the curve at the time you are interested in.
- Make the tangent as long as you can, because a longer line gives a more accurate gradient.
- Read the change in quantity and the change in time along the tangent.
- The gradient of the tangent is the rate of reaction at that instant.
Example
- A tangent drawn at 20 s20\ \text{s}20 s rises by 30 cm330\ \text{cm}^330 cm3 over 20 s20\ \text{s}20 s of the graph.
- The rate at that moment is 3020=1.5 cm3/s\dfrac{30}{20} = 1.5\ \text{cm}^3\text{/s}2030=1.5 cm3/s.
Common Mistake
- Draw the tangent so it touches the curve at one point, not so it cuts across it.
- Use a large triangle on the tangent, because a small one makes the gradient less accurate.
Exam technique
- For an overall rate, use the whole change and the total time; for the rate at a moment, use a tangent.
- Mark the triangle you used on the graph so the examiner can follow your gradient.
- Give the unit of the rate, matching the axis you measured.
Self review
- Why is a rate graph steepest at the start?
- What does a flat section of the line show?
- How do you find the rate at a particular time from a curved graph?
- Why should a tangent be drawn as long as possible?
