Rate of reaction measures how quickly reactants turn into products
Definition
Rate of reaction
The change in the quantity of a reactant used or a product formed per unit time.
Definition
Reactant
A reactant is a substance that is changed or used up during a chemical reaction.
- The rate of reaction tells you how quickly a reactant is used up or a product is made.
- You can follow the rate by measuring either a reactant being used up or a product being formed.
- The mean rate is the average rate over a chosen time.
- Find it from mean rate=quantity of reactant used or product formedtime taken\text{mean rate} = \dfrac{\text{quantity of reactant used or product formed}}{\text{time taken}}mean rate=time takenquantity of reactant used or product formed.
- The unit depends on what you measured: mass gives g/s\text{g/s}g/s, gas volume gives cm3/s\text{cm}^3\text{/s}cm3/s and amount gives mol/s\text{mol/s}mol/s.
Key Idea
- Rate is a change in quantity divided by the time taken for that change.
- Following the reactant or the product gives the same reaction rate.
Follow a rate by mass loss, gas volume or cloudiness
Definition
Product
A product is a substance formed during a chemical reaction.
- Mass loss: stand the flask on a balance and record the falling mass as a gas escapes.
- Gas volume: collect the gas in a gas syringe or an upturned measuring cylinder and record its volume.
- Cloudiness: time how long a reaction takes to hide a mark placed under the flask.
- Which method you choose depends on whether the reaction gives off a gas or forms a cloudy solid.
Example
- A reaction gives off 24 cm324\ \text{cm}^324 cm3 of gas in 40 s40\ \text{s}40 s.
- The mean rate is 2440=0.6 cm3/s\dfrac{24}{40} = 0.6\ \text{cm}^3\text{/s}4024=0.6 cm3/s.
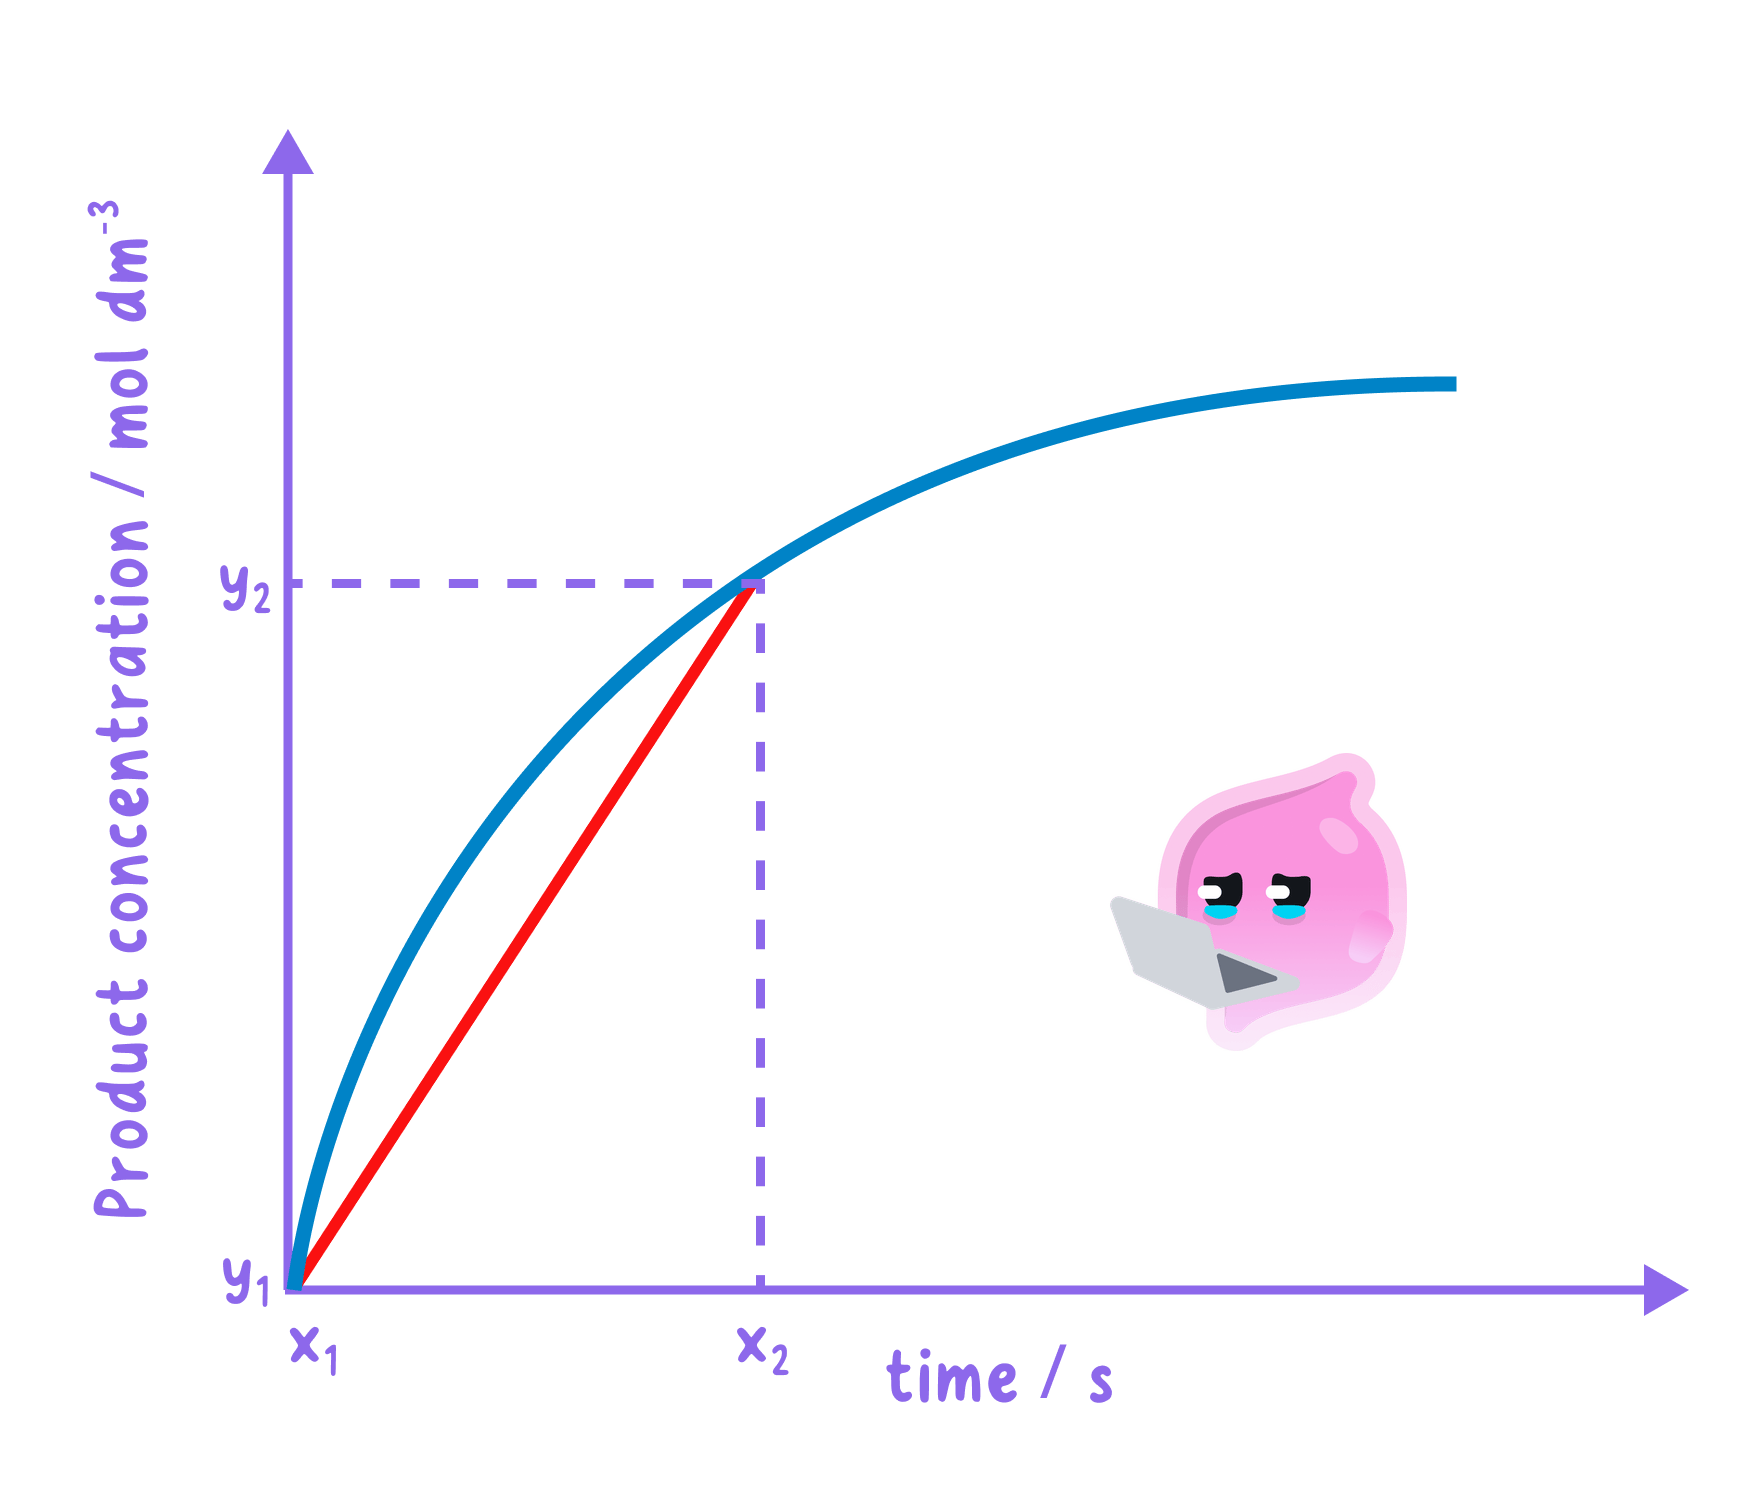
Read a mean rate straight from the numbers, keeping the units
- Take the quantity at the start and at the end of the time you are interested in.
- Subtract to find the change in quantity, then divide by the time taken.
- Write the unit that matches the measurement, such as cm3/s\text{cm}^3\text{/s}cm3/s or g/s\text{g/s}g/s.
- A mean rate is an average, so it does not show that the reaction is fastest at the start.
Exam technique
- Show the change in quantity and the time as a fraction, then divide, so the method is clear.
- Always give the unit; a rate with no unit usually loses a mark.
- Read values carefully from a graph or table before you subtract.
Self review
- What does the rate of a reaction tell you?
- Write the equation for the mean rate of a reaction.
- Give two quantities you could measure to follow a reaction that gives off a gas.
- A reaction forms 36 cm336\ \text{cm}^336 cm3 of gas in 30 s30\ \text{s}30 s; what is the mean rate?
