Using findings to make decisions
- Research only earns its cost if it changes a decision, so findings are organised into tables and charts, read for a pattern, then acted on.
- The findings feed straight into the marketing mix: what to sell, what to charge for it, how to promote it and where to sell it.
- Quantitative findings show the size of a pattern and qualitative findings explain what is causing it, and a business normally wants both before committing money.
- How far the business can act on the findings depends on its type, because a sole trader can change a menu on Monday morning while Tesco has to trial a change in a few stores before rolling it out to hundreds.
Example
- Deliveroo uses its order data to see which cuisines customers search for but cannot get in an area, then recruits restaurants to fill the gap.
- The finding becomes an action, which is the whole point of collecting it.
Market size and market share
Definition
Market size: the total value or volume of sales made by every business selling in that market.
Market share: the proportion of that total held by one business, expressed as a percentage.
- Market size is measured either by value, the total £ spent, or by volume, the number of units sold, so the same market can be described as worth £40m a year or as selling 2 million units a year.
- Market size tells a business whether a market is big enough to be worth entering, and whether it is growing or shrinking.
- Market share tells it how it is performing against rivals, which its own sales figures alone cannot, because sales can rise while competitors grow faster still.
Calculating and interpreting market share
- The formula is not supplied in the exam, so learn it and write it out before you substitute anything.
Example
market share=business salestotal market sales×100
\text{market share} = \frac{\text{business sales}}{\text{total market sales}} \times 100
market share=total market salesbusiness sales×100
- A bakery chain sells £3.5m of bread in a regional market worth £25m in total, and the year before it sold £2.4m in a market worth £20m.
Example
market share this year=£3,500,000£25,000,000×100=14%
\text{market share this year} = \frac{\pounds3{,}500{,}000}{\pounds25{,}000{,}000} \times 100 = 14\%
market share this year=£25,000,000£3,500,000×100=14%
market share last year=£2,400,000£20,000,000×100=12%
\text{market share last year} = \frac{\pounds2{,}400{,}000}{\pounds20{,}000{,}000} \times 100 = 12\%
market share last year=£20,000,000£2,400,000×100=12%
- A 14% share means £14 of every £100 spent on bread in that market goes to this bakery and £86 goes to its rivals, so it is a serious player but a long way from dominating.
- The rise from 12% to 14% tells the owner that sales grew faster than the market as a whole, because the chain's own sales rose from £2.4m to £3.5m while the market grew only from £20m to £25m, so it has won customers from rivals rather than simply riding a growing market.
Common Mistake
- Rising sales can still mean a falling share, so check what the whole market did before calling a sales increase a success.
- Check the units before you divide, because mixing figures in £000s with figures in £ turns a 14% share into 14,000%.
Reading data from tables and charts
- Read the title, the row and column headings, the units and the time period before you look at a single figure.
- Tables give exact figures, which is what you need for a calculation or a precise comparison between two years.
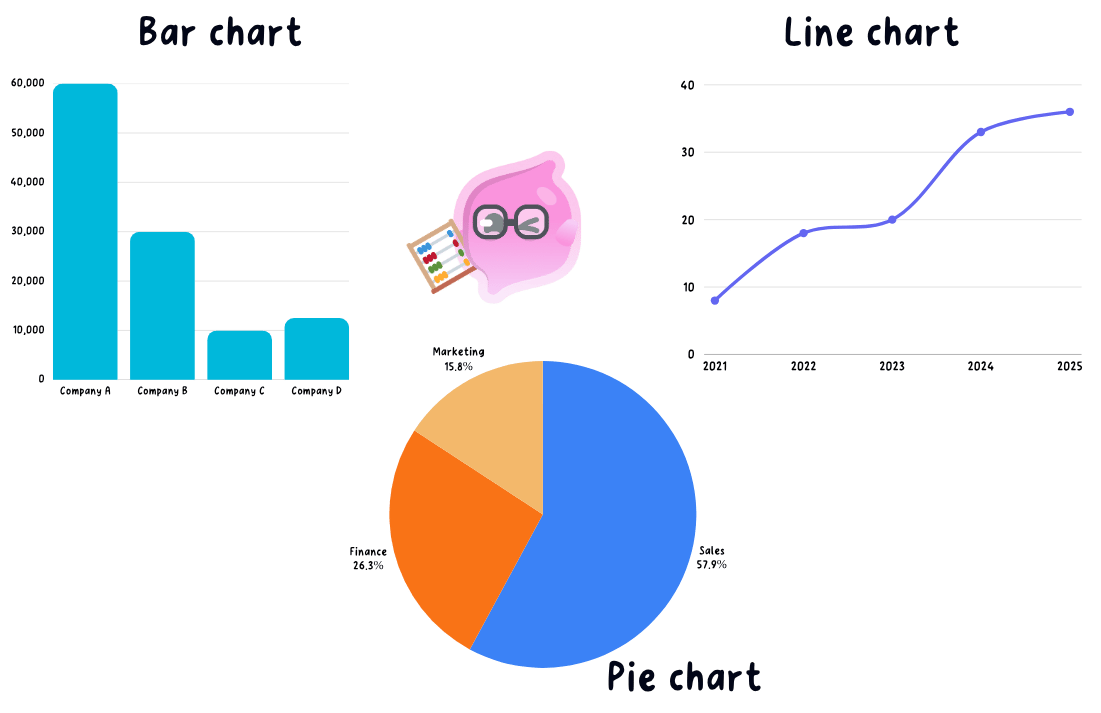
- Bar charts compare quantities across categories, so read each bar against the scale rather than judging heights by eye.
- If one rival's bar reaches £60,000 and another's reaches £30,000 the first sells twice as much, but only if the vertical axis starts at zero.
- Line graphs show a trend over time, so describe the direction and the speed of the change and look for a pattern that repeats each year.
- Pie charts show proportions of a whole, which makes them the natural way to present market share.
Drawing a conclusion from the figures
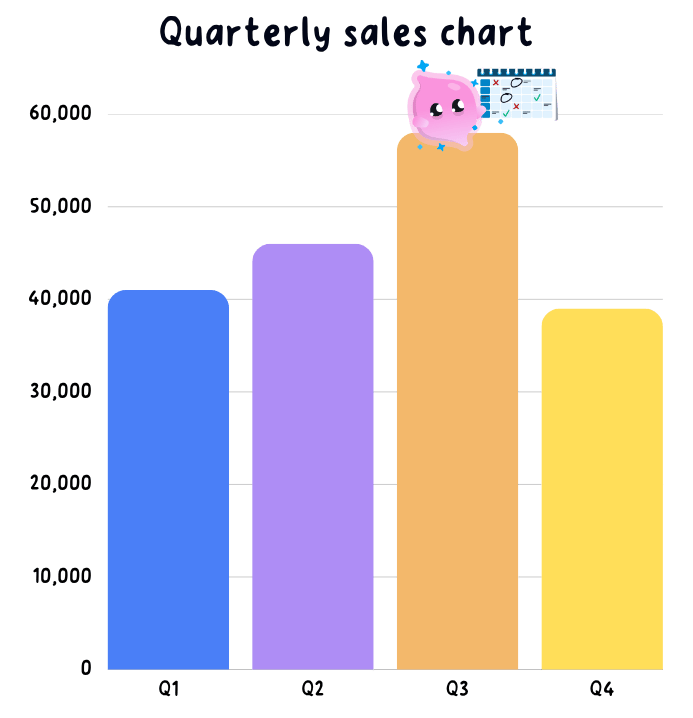
- A café owner's sales table shows takings of £41,000 in quarter 1, £46,000 in quarter 2, £58,000 in quarter 3 and £39,000 in quarter 4.
- The pattern is a summer peak and a winter dip rather than a business in decline, because quarter 4 is still close to quarter 1.
- Measure the change rather than describing it, rounding the percentage to one decimal place.
Example
percentage change=new figure−original figureoriginal figure×100
\text{percentage change} = \frac{\text{new figure} - \text{original figure}}{\text{original figure}} \times 100
percentage change=original figurenew figure−original figure×100
£39,000−£58,000£58,000×100=−32.8%
\frac{\pounds39{,}000 - \pounds58{,}000}{\pounds58{,}000} \times 100 = -32.8\%
£58,000£39,000−£58,000×100=−32.8%
- A fall of almost a third from quarter 3 to quarter 4 is big enough to plan for, so the owner should cut winter staffing hours and promote hot food from October rather than conclude that the café is failing.
- Sense-check the data before spending on the strength of it, because a striking figure taken from 20 responses or from a single week is a weak basis for a decision.
Exam technique
- A common wording is calculate the market share of this business, so write the formula, substitute the figures with their units, then say in a sentence what the answer means for the firm.
- Quote figures from the table with their units, because 'sales fell from £58,000 to £39,000' is evidence while 'sales fell' is not.
- The mistake to avoid is walking through the chart line by line without ever reaching a conclusion the owner could act on.
Self review
- Define market size and market share.
- State the formula for market share from memory.
- Why can rising sales still mean a falling market share?
- What does a share rising from 12% to 14% tell the owner?
- Name two things to check on a table or chart before drawing a conclusion from it.
