Biomass measures biological material
Definition
Biomass
The mass of living material in an organism, usually measured as dry mass because water content varies.
Definition
Pyramid of biomass
A pyramid of biomass is a diagram whose bar widths represent the total biomass at successive trophic levels.
- Biomass compares the amount of biological material in organisms rather than simply counting the organisms.
- It is usually measured as dry mass, so differences in water content do not dominate the comparison.
- For example, two samples with the same fresh mass may contain different amounts of dry biological material if one contains more water.
- A biomass value must identify the organisms, the area sampled and the time of measurement for a fair comparison.
- Values may be expressed as total dry mass, such as g\mathrm{g}g or kg\mathrm{kg}kg, or as dry mass per unit area, such as g m−2\mathrm{g\,m^{-2}}gm−2.
- To find the biomass of a trophic level, combine the biomass of all the organisms assigned to that level in the area being compared.
Practical
Measuring dry biomass
- Aim: measure the dry biomass of a small representative plant sample while removing variation due to its water content.
- Apparatus: use a balance, labelled heat-resistant weighing containers, a teacher-controlled drying oven, forceps and a suitable place for samples to cool without taking up moisture.
- Method, drying and weighing:
- Use a small teacher-provided plant sample, or collect a permitted representative sample from a measured area without damaging protected plants or habitats.
- Weigh the empty, dry container and record its mass before adding the sample.
- Remove adhering soil carefully, keep all the plant material being measured and record the mass of the container with the fresh sample.
- Place the container and sample in a drying oven at a suitable low drying temperature, such as 80 ∘C80\,^{\circ}\mathrm{C}80∘C under the teacher’s method, until much of the water has evaporated.
- Allow the container to cool in a dry place before weighing, then return it to the oven for a further drying period.
- Repeat drying, cooling and weighing until successive masses agree within the balance’s resolution, indicating that further drying causes no measurable loss.
- Results and processing:
- Subtract the empty-container mass from the final constant mass of the container and dried sample to obtain the sample’s dry biomass.
- If samples came from different measured areas, divide each dry mass by its sampled area before comparing the results.
- Dry several representative samples separately and calculate a mean, because one sample may not represent variation within the habitat.
- Limitations: drying is destructive and only measures the sampled material, so estimate wider biomass cautiously and minimise the number of organisms collected.
- Safety: use heat-resistant handling equipment for hot containers, follow the teacher’s oven instructions and avoid inhaling dust from dried material.
Draw bars using one scale
- Place producers at the base, followed by primary consumers and then any higher consumers in feeding order.
- Draw horizontal rectangular bars of equal height, with each bar centred on the same vertical line.
- Make the bar width proportional to total biomass, using the same scale at every trophic level.
- Label each bar with its trophic level or organisms and give the biomass values and units.
- For a chosen scale, calculate bar width=biomass valuebiomass represented by one unit of width\text{bar width}=\dfrac{\text{biomass value}}{\text{biomass represented by one unit of width}}bar width=biomass represented by one unit of widthbiomass value.
- The width represents the biomass of the whole level, not the size or biomass of one average organism.
Example
- Suppose the biomass values are 1200 g m−21200\,\mathrm{g\,m^{-2}}1200gm−2 for producers, 240 g m−2240\,\mathrm{g\,m^{-2}}240gm−2 for primary consumers and 60 g m−260\,\mathrm{g\,m^{-2}}60gm−2 for secondary consumers.
- Using a scale of 1 cm1\,\mathrm{cm}1cm for each 120 g m−2120\,\mathrm{g\,m^{-2}}120gm−2, the producer bar is 1200120=10 cm\dfrac{1200}{120}=10\,\mathrm{cm}1201200=10cm wide.
- The primary-consumer bar is 240120=2 cm\dfrac{240}{120}=2\,\mathrm{cm}120240=2cm wide.
- The secondary-consumer bar is 60120=0.5 cm\dfrac{60}{120}=0.5\,\mathrm{cm}12060=0.5cm wide.
- Centre all three bars and keep their heights equal so that their widths show the differences in biomass.
Only part of food becomes new biomass
- A consumer must eat, digest and absorb food before some of its molecules can become part of new cells.
- Uneaten material never enters that consumer, for example roots left behind when a rabbit eats a plant’s leaves.
- Undigested material passes through the gut and is removed in faeces by egestion, so it is not absorbed and incorporated into the consumer’s tissues.
- For example, some tough plant material in an animal’s diet may be egested rather than digested.
- Some absorbed substances are broken down to make metabolic waste, which is removed by excretion.
- For example, removing urea in urine transfers nitrogen-containing material out of a mammal’s body.
- During respiration, organic molecules are broken down and their atoms can leave the body in substances such as carbon dioxide and water.
- The energy released by respiration supports processes including movement and maintenance, with energy eventually dissipated as heat.
- Only the material retained in growth and reproduction adds to the consumer biomass that can be passed on when it is eaten.
Common Mistake
- Egestion removes undigested food from the gut, whereas excretion removes waste produced by metabolism.
- Biomass is not converted into heat: respiration transfers atoms into products while releasing energy, which can be dissipated as heat.
Biomass usually decreases up the chain
- Because much material is not retained as new consumer tissue, less biomass is usually supported at each successive trophic level.
- This produces the familiar upright pyramid, with a wide producer bar and narrower bars above it.
- Material leaving one food-chain pathway has not vanished: uneaten remains and waste can supply decomposers and enter material cycles.
- A pyramid of biomass is a snapshot, so the values can change with season, growth, reproduction and death.
- In some aquatic systems, small producers reproduce and are eaten so rapidly that their biomass at one instant can be lower than the biomass of the consumers they support.
- Such a snapshot does not show more biomass being created at each transfer; the producer biomass is being continually replaced.
Exam technique
- When explaining a smaller biomass at the next level, identify a specific route such as uneaten tissue, egested material, excreted waste or respiration.
- Link that route to material not retained in new consumer tissue, rather than saying only that biomass is lost.
Read the quantity each diagram shows
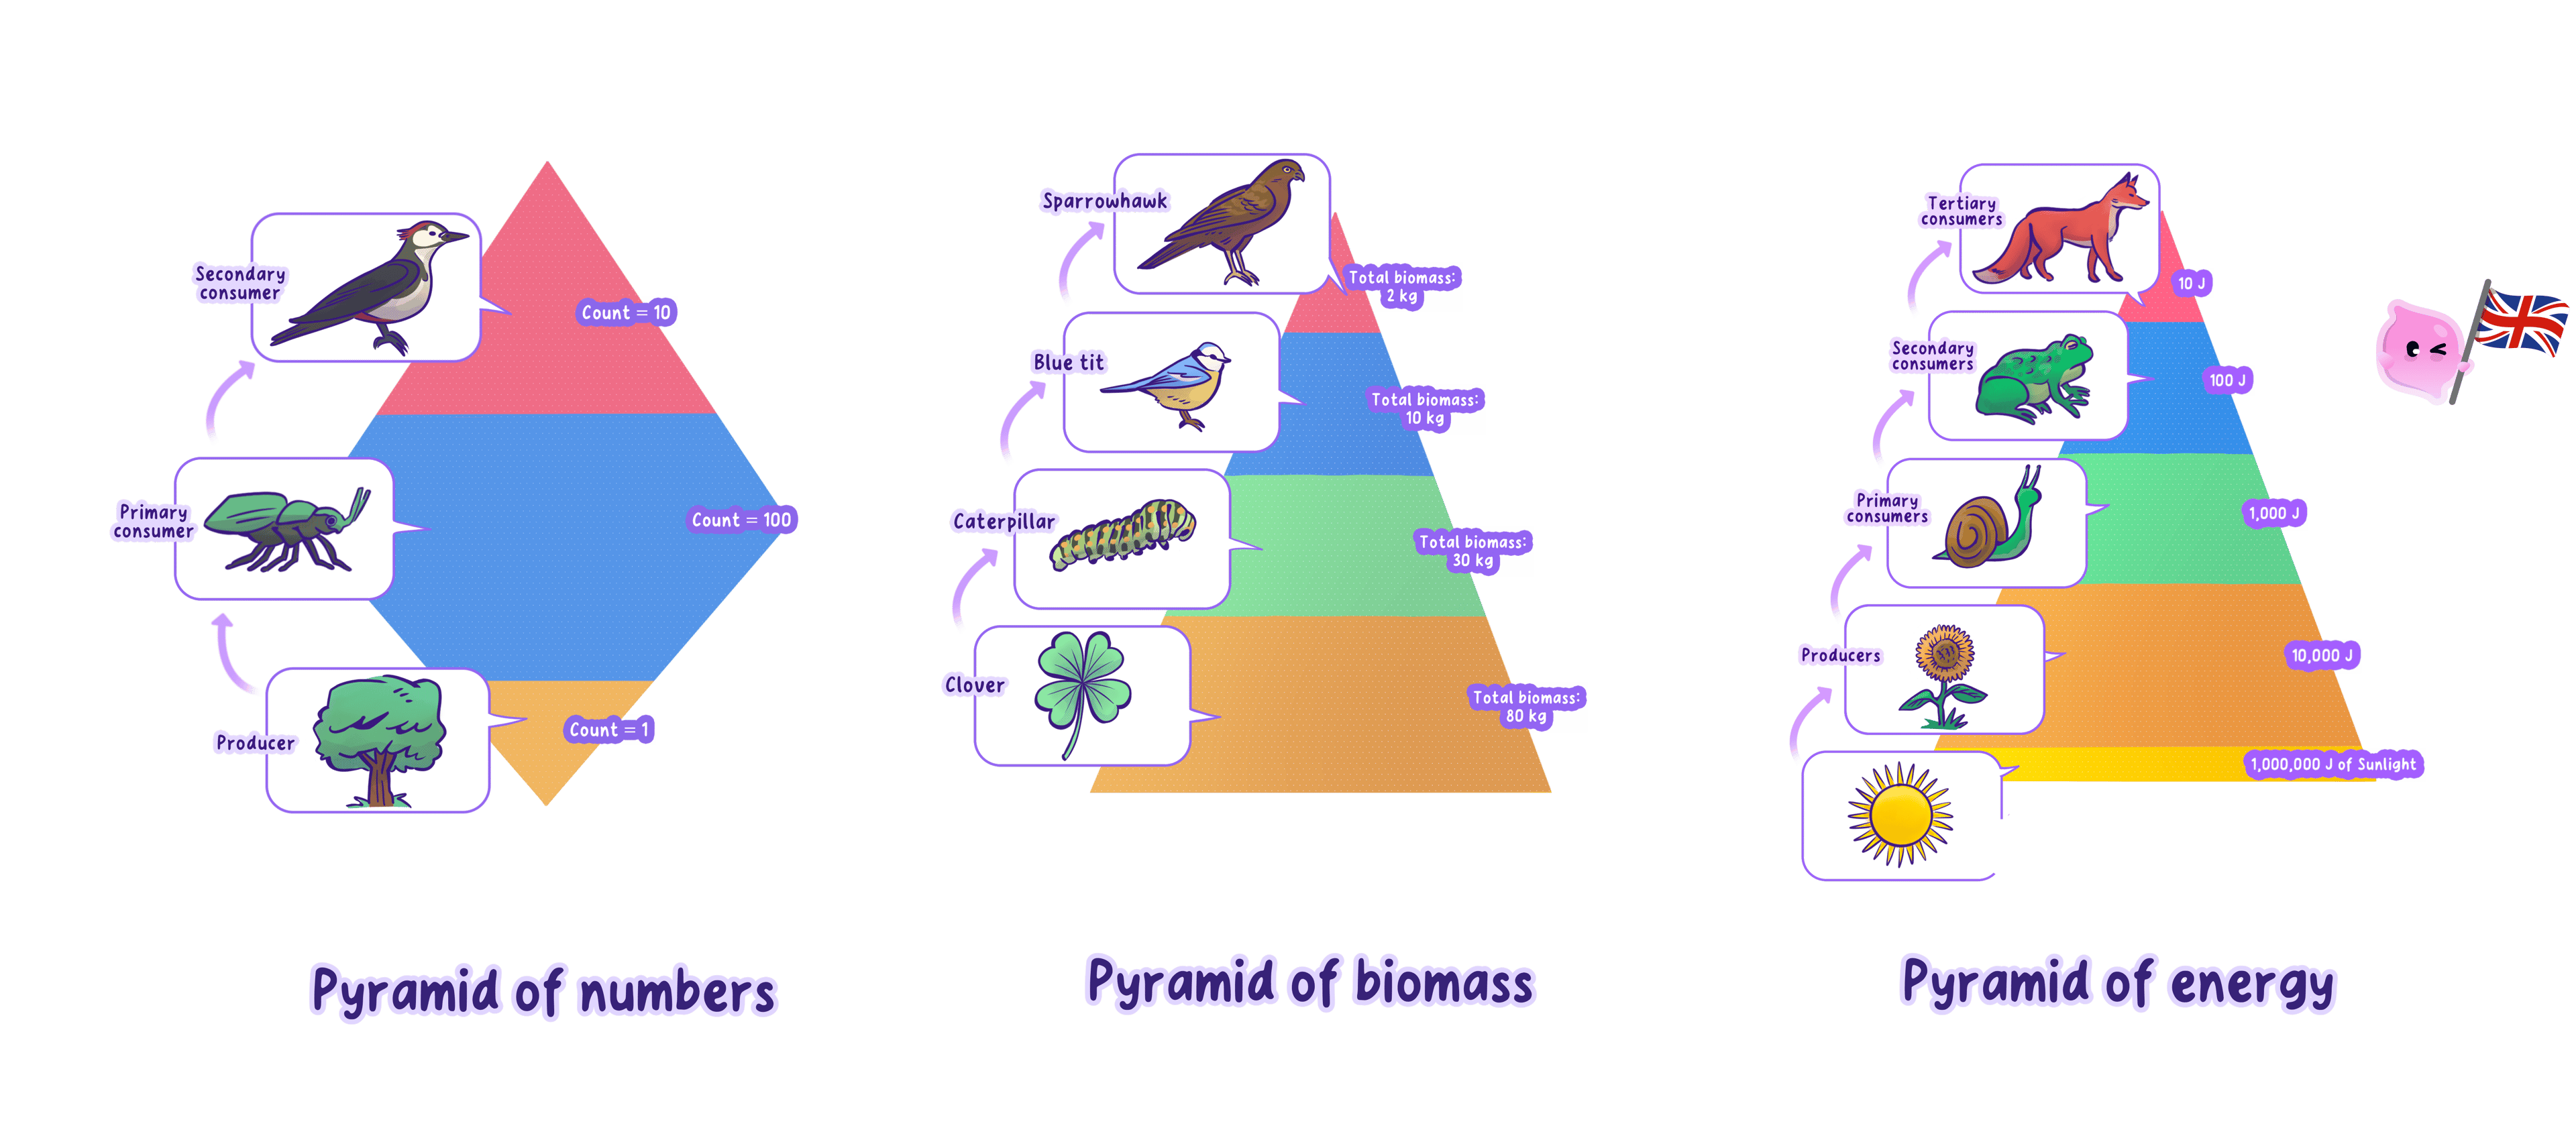
- A pyramid of numbers counts organisms, so one large tree can have a narrower bar than the many small insects feeding on it.
- A biomass pyramid takes their different sizes into account by comparing their total mass.
- A diagram showing energy transferred over an area and time measures a different quantity from a snapshot of biomass.
- Read the labels and units before interpreting the retained comparison diagram, and do not treat organism number, dry mass and energy as interchangeable.
Self review
- Why is biomass usually measured as dry mass?
- What does the width of a biomass-pyramid bar represent?
- Why does egested material not become new consumer biomass?
- How does respiration reduce the organic material retained in a consumer?
- Why can a snapshot of an aquatic biomass pyramid have a small producer bar?
