Most features involve many genes
Polygenic inheritance
Polygenic inheritance is the control of one characteristic by several genes, each contributing part of the phenotype.
- Single gene inheritance, with two clear alleles and a predictable ratio, is the exception among characteristics rather than the rule.
- Polygenic inheritance means that one characteristic is controlled by several genes, which are often carried on different chromosomes.
- Each of those genes has its own alleles, and each one contributes a small part of the finished characteristic.
- The small contributions add together, so an individual carrying more of the alleles that increase the characteristic ends up further along the range.
- Human height, body mass, skin colour and eye colour are all controlled in this way.
- Skin colour depends on several genes that between them control how much melanin the skin cells produce.
- Eye colour was once taught as a single gene with brown dominant over blue, but several genes are now known to contribute to it.
- The link runs the other way as well, because one gene can affect more than one characteristic at the same time.
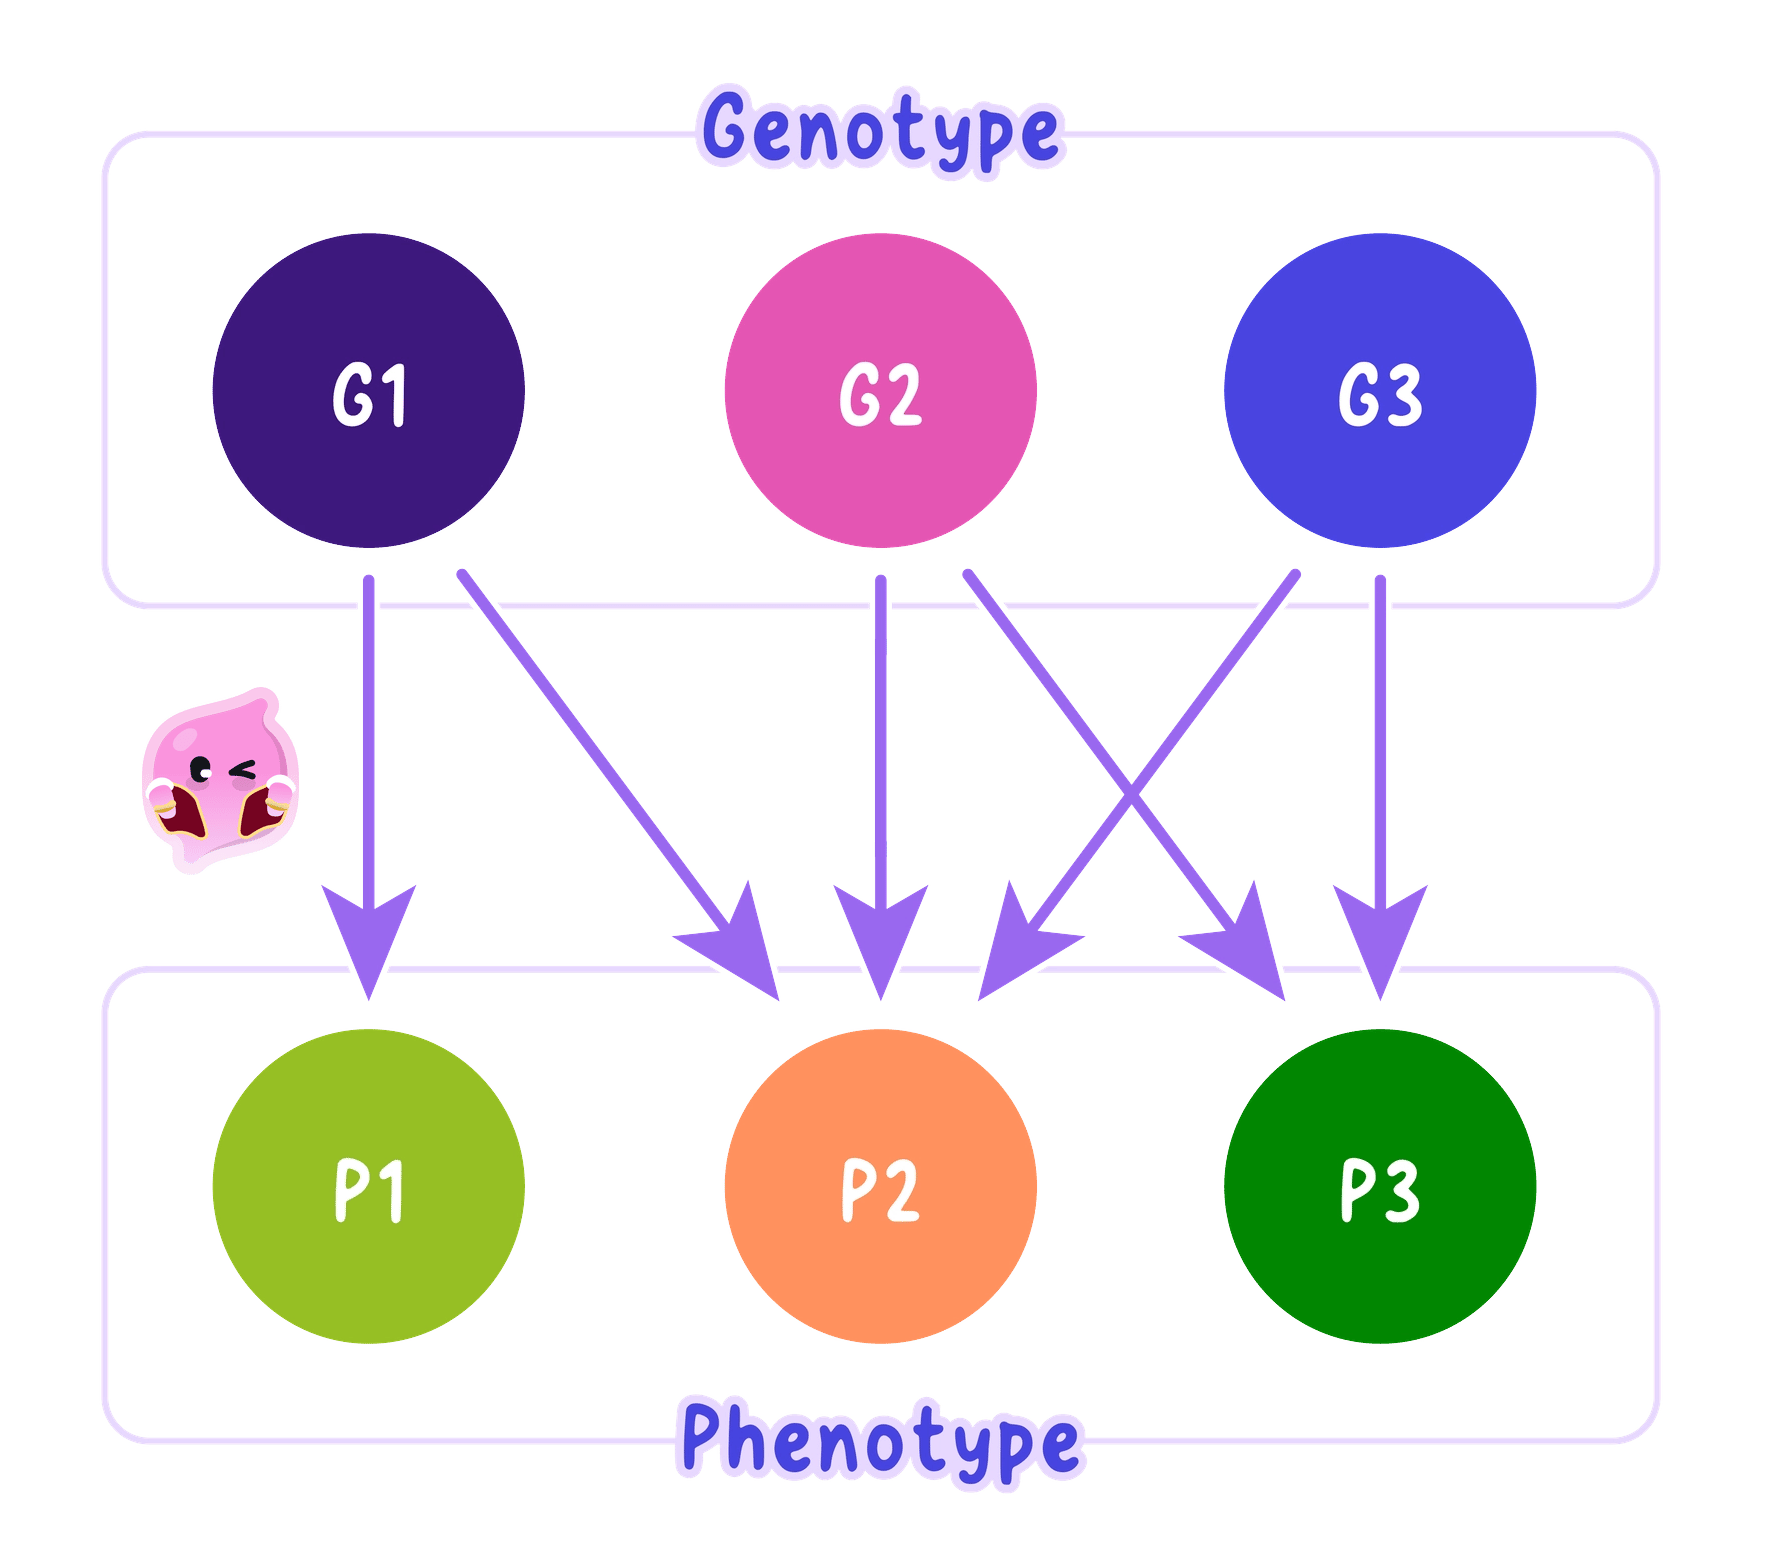
One gene affecting several characteristics and several genes affecting one characteristic are both common, which is why a single gene rarely maps neatly onto a single feature.
Why the range is continuous
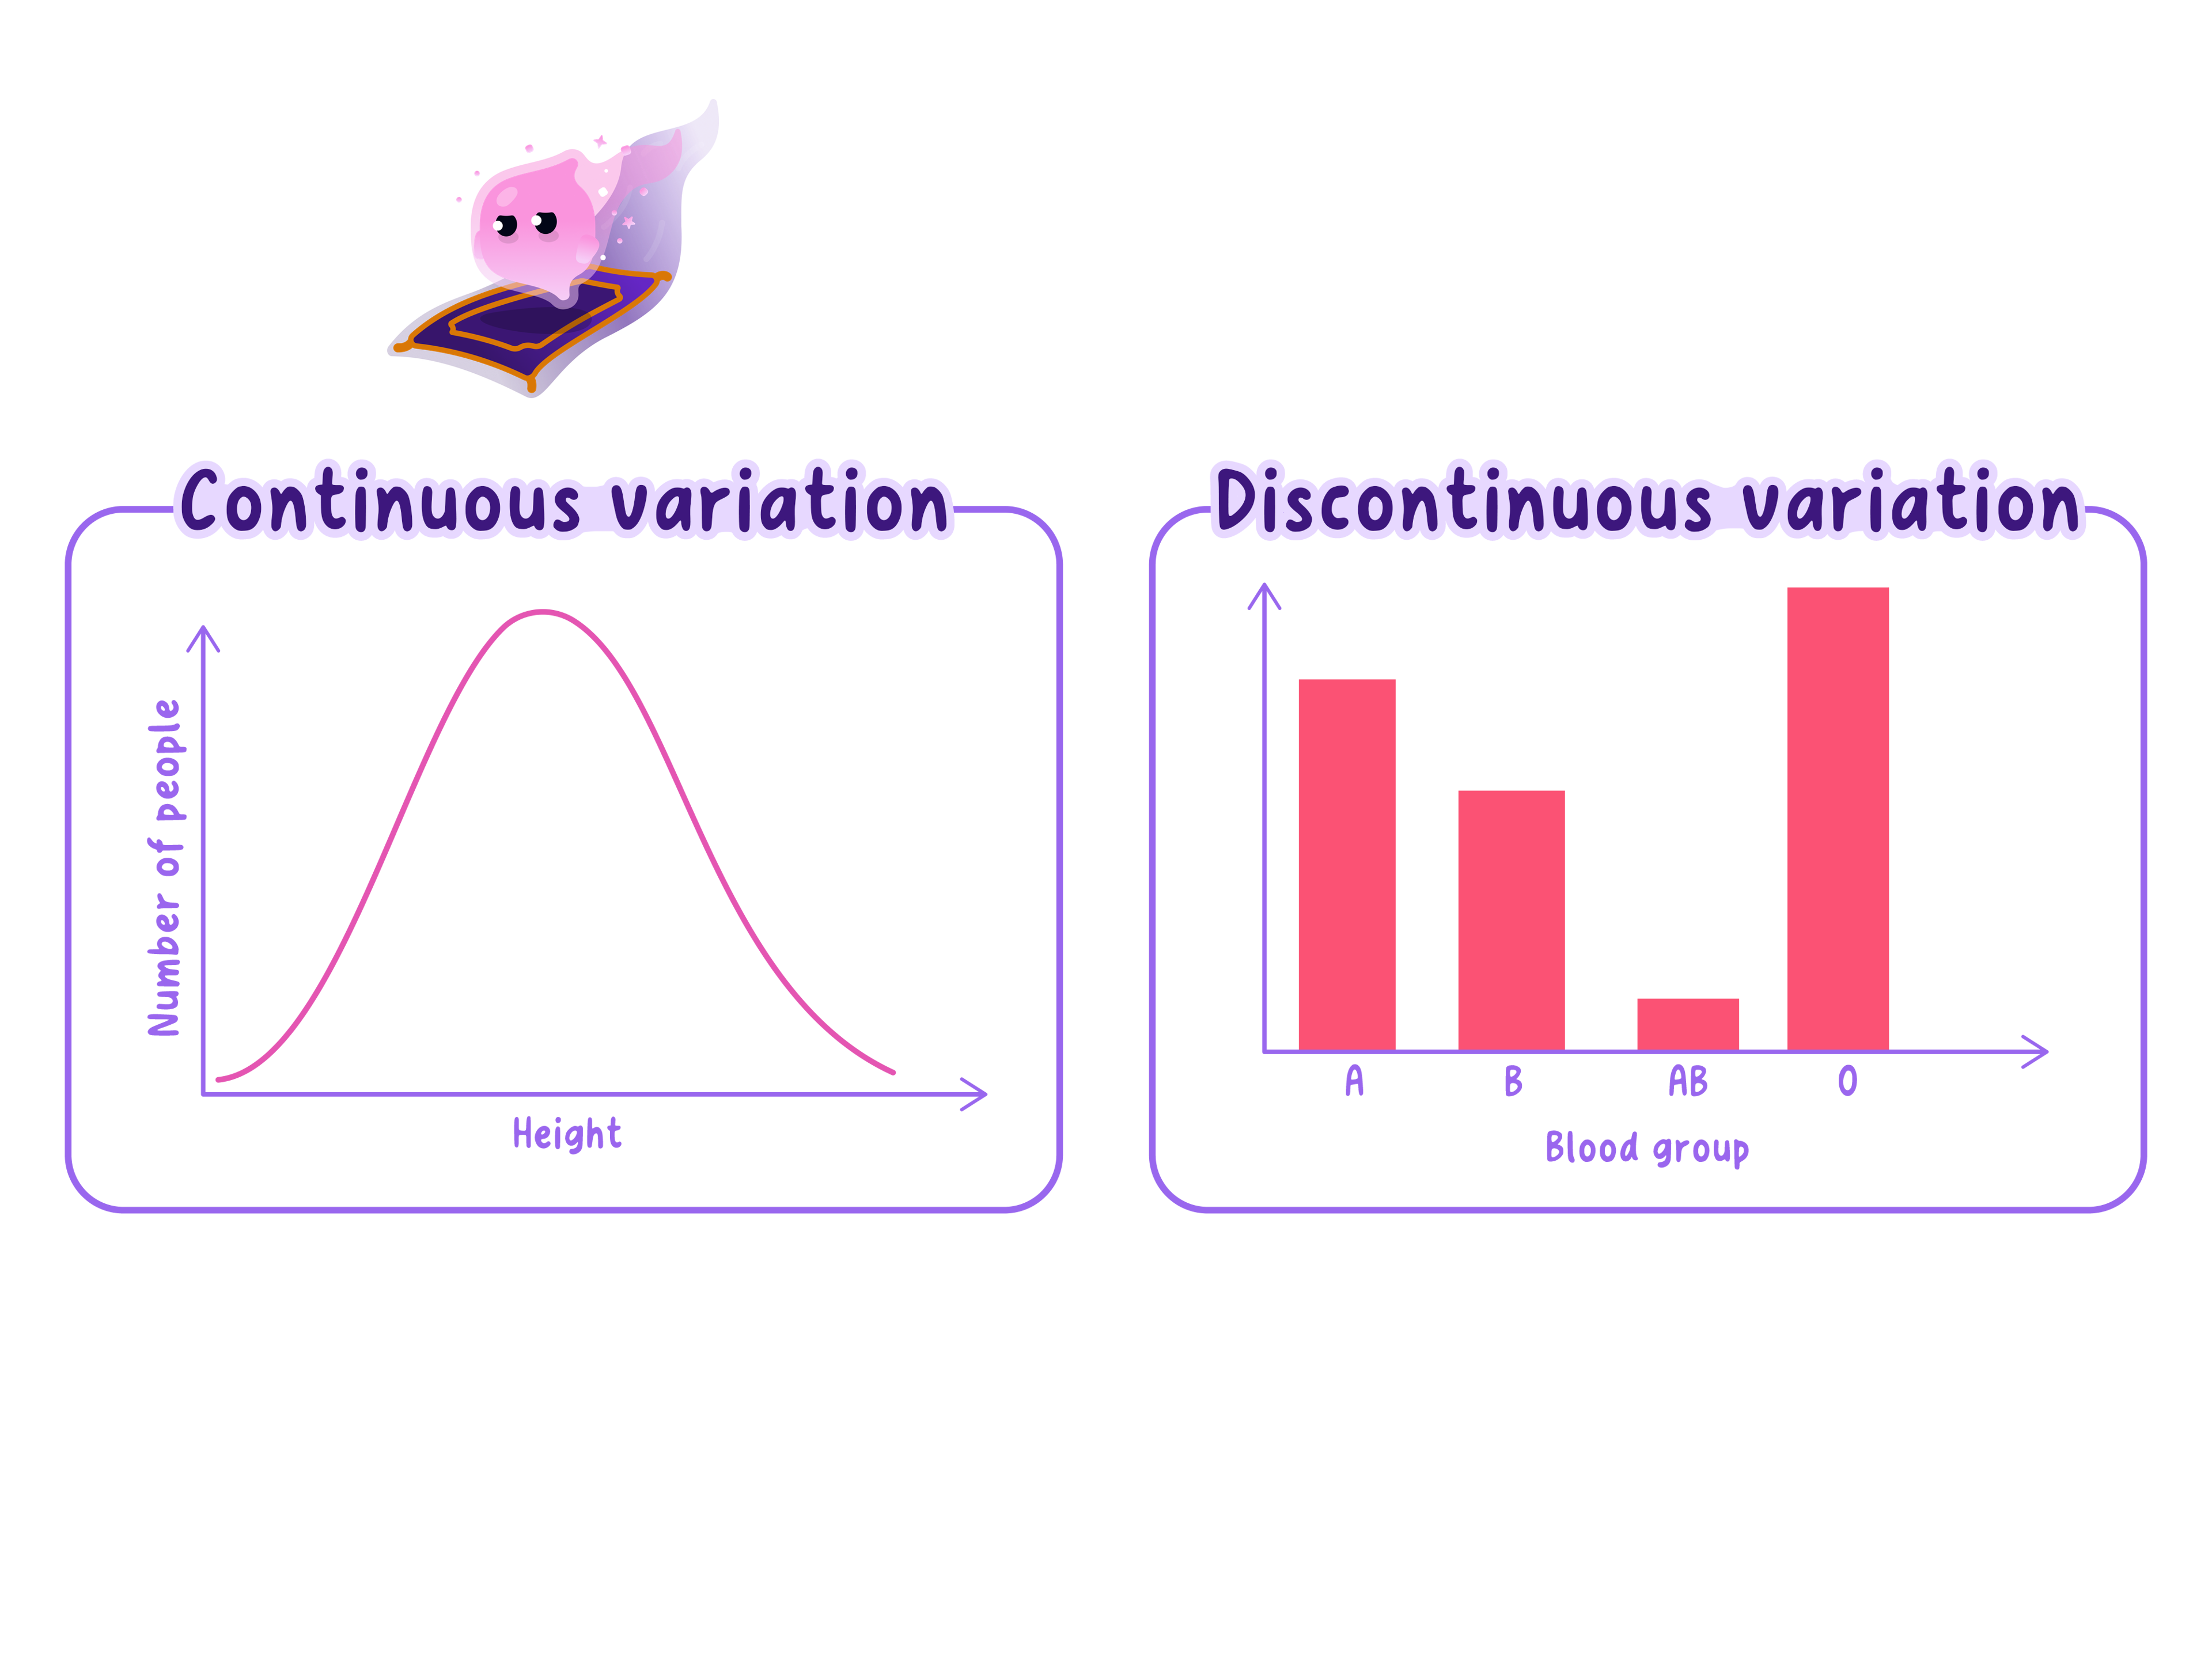
Continuous variation
Continuous variation is variation in a characteristic across a range with intermediate values and no distinct categories.
Discontinuous variation
Discontinuous variation is variation in which a characteristic falls into distinct categories without intermediate values.
- A characteristic controlled by one gene with two alleles has only a few possible outcomes, so individuals fall into separate groups with nothing in between.
- That pattern is discontinuous variation, and the data are displayed as a bar chart with a gap between each bar.
- A characteristic controlled by many genes has a very large number of possible allele combinations.
- For nnn genes each having two alleles, the number of possible genotypes is 3n3^{n}3n, so even five genes give 35=2433^{5} = 24335=243 different genotypes.
- Those many combinations produce values that overlap and run smoothly from one extreme to the other with no gaps.
- That pattern is continuous variation, and the data are displayed as a histogram whose bars touch.
- The histogram of a polygenic characteristic usually forms a bell shaped curve, with most individuals near the middle and few at either extreme.
- The environment widens the range still further, because factors such as diet and sunlight change the value an individual actually reaches.
- Human height shows both effects at once, since many genes set the potential height and nutrition during childhood decides how much of it is reached.
Do not treat a continuous characteristic such as height as though it had one tall allele and one short allele. Many genes contribute to it, so there is no single pair of alleles to write down.
Working with polygenic features
- A Punnett square cannot be drawn for a polygenic characteristic, because each parent produces far more gamete types than a 2×22 \times 22×2 grid can hold.
- Polygenic characteristics are therefore studied by measuring and plotting distributions rather than by predicting ratios.
- Data are collected by measuring a large sample, grouping the values into equal classes and plotting the frequency of each class.
- A large sample matters, because a small one leaves gaps that make continuous variation look discontinuous.
- Offspring of a polygenic characteristic tend to fall somewhere between their two parents rather than matching either one exactly.
- Two tall parents usually have tall children, but no genetic diagram can predict the exact height of any one child.
- A characteristic that clearly runs in families yet never gives clean 3:13:13:1 or 1:11:11:1 ratios is a strong sign that several genes are involved.
- The heights of 303030 students are measured to the nearest centimetre and grouped into classes 5 cm5\ \text{cm}5 cm wide.
- The tallest student is 184 cm184\ \text{cm}184 cm and the shortest is 152 cm152\ \text{cm}152 cm, so the range is 184−152=32 cm184 - 152 = 32\ \text{cm}184−152=32 cm.
- Every class between those two values contains at least one student, so the distribution has no empty gaps.
- The largest numbers fall in the middle classes and the smallest numbers at the two ends, giving the bell shaped pattern expected of a polygenic characteristic.
- Repeating the measurements on 300300300 students instead of 303030 smooths the curve further, because more values fill each class.
- Decide first whether the characteristic falls into distinct groups or runs across a range, because that decision sets the type of chart required.
- Draw a bar chart with gaps between the bars for discontinuous data, and a histogram with touching bars for continuous data.
- Write that several genes contribute rather than simply that the characteristic is controlled by genes, because the number of genes is the point being tested.
- Add the environment as a second cause whenever the characteristic is one such as height or body mass.
- What is polygenic inheritance?
- Name three human characteristics that are controlled by several genes.
- Explain why a polygenic characteristic produces a continuous range of values.
- Which type of chart is used for continuous data, and which for discontinuous data?
- Explain why a Punnett square cannot be used to predict a child's height.
