Genes and environment shape phenotype
Definition
Phenotype
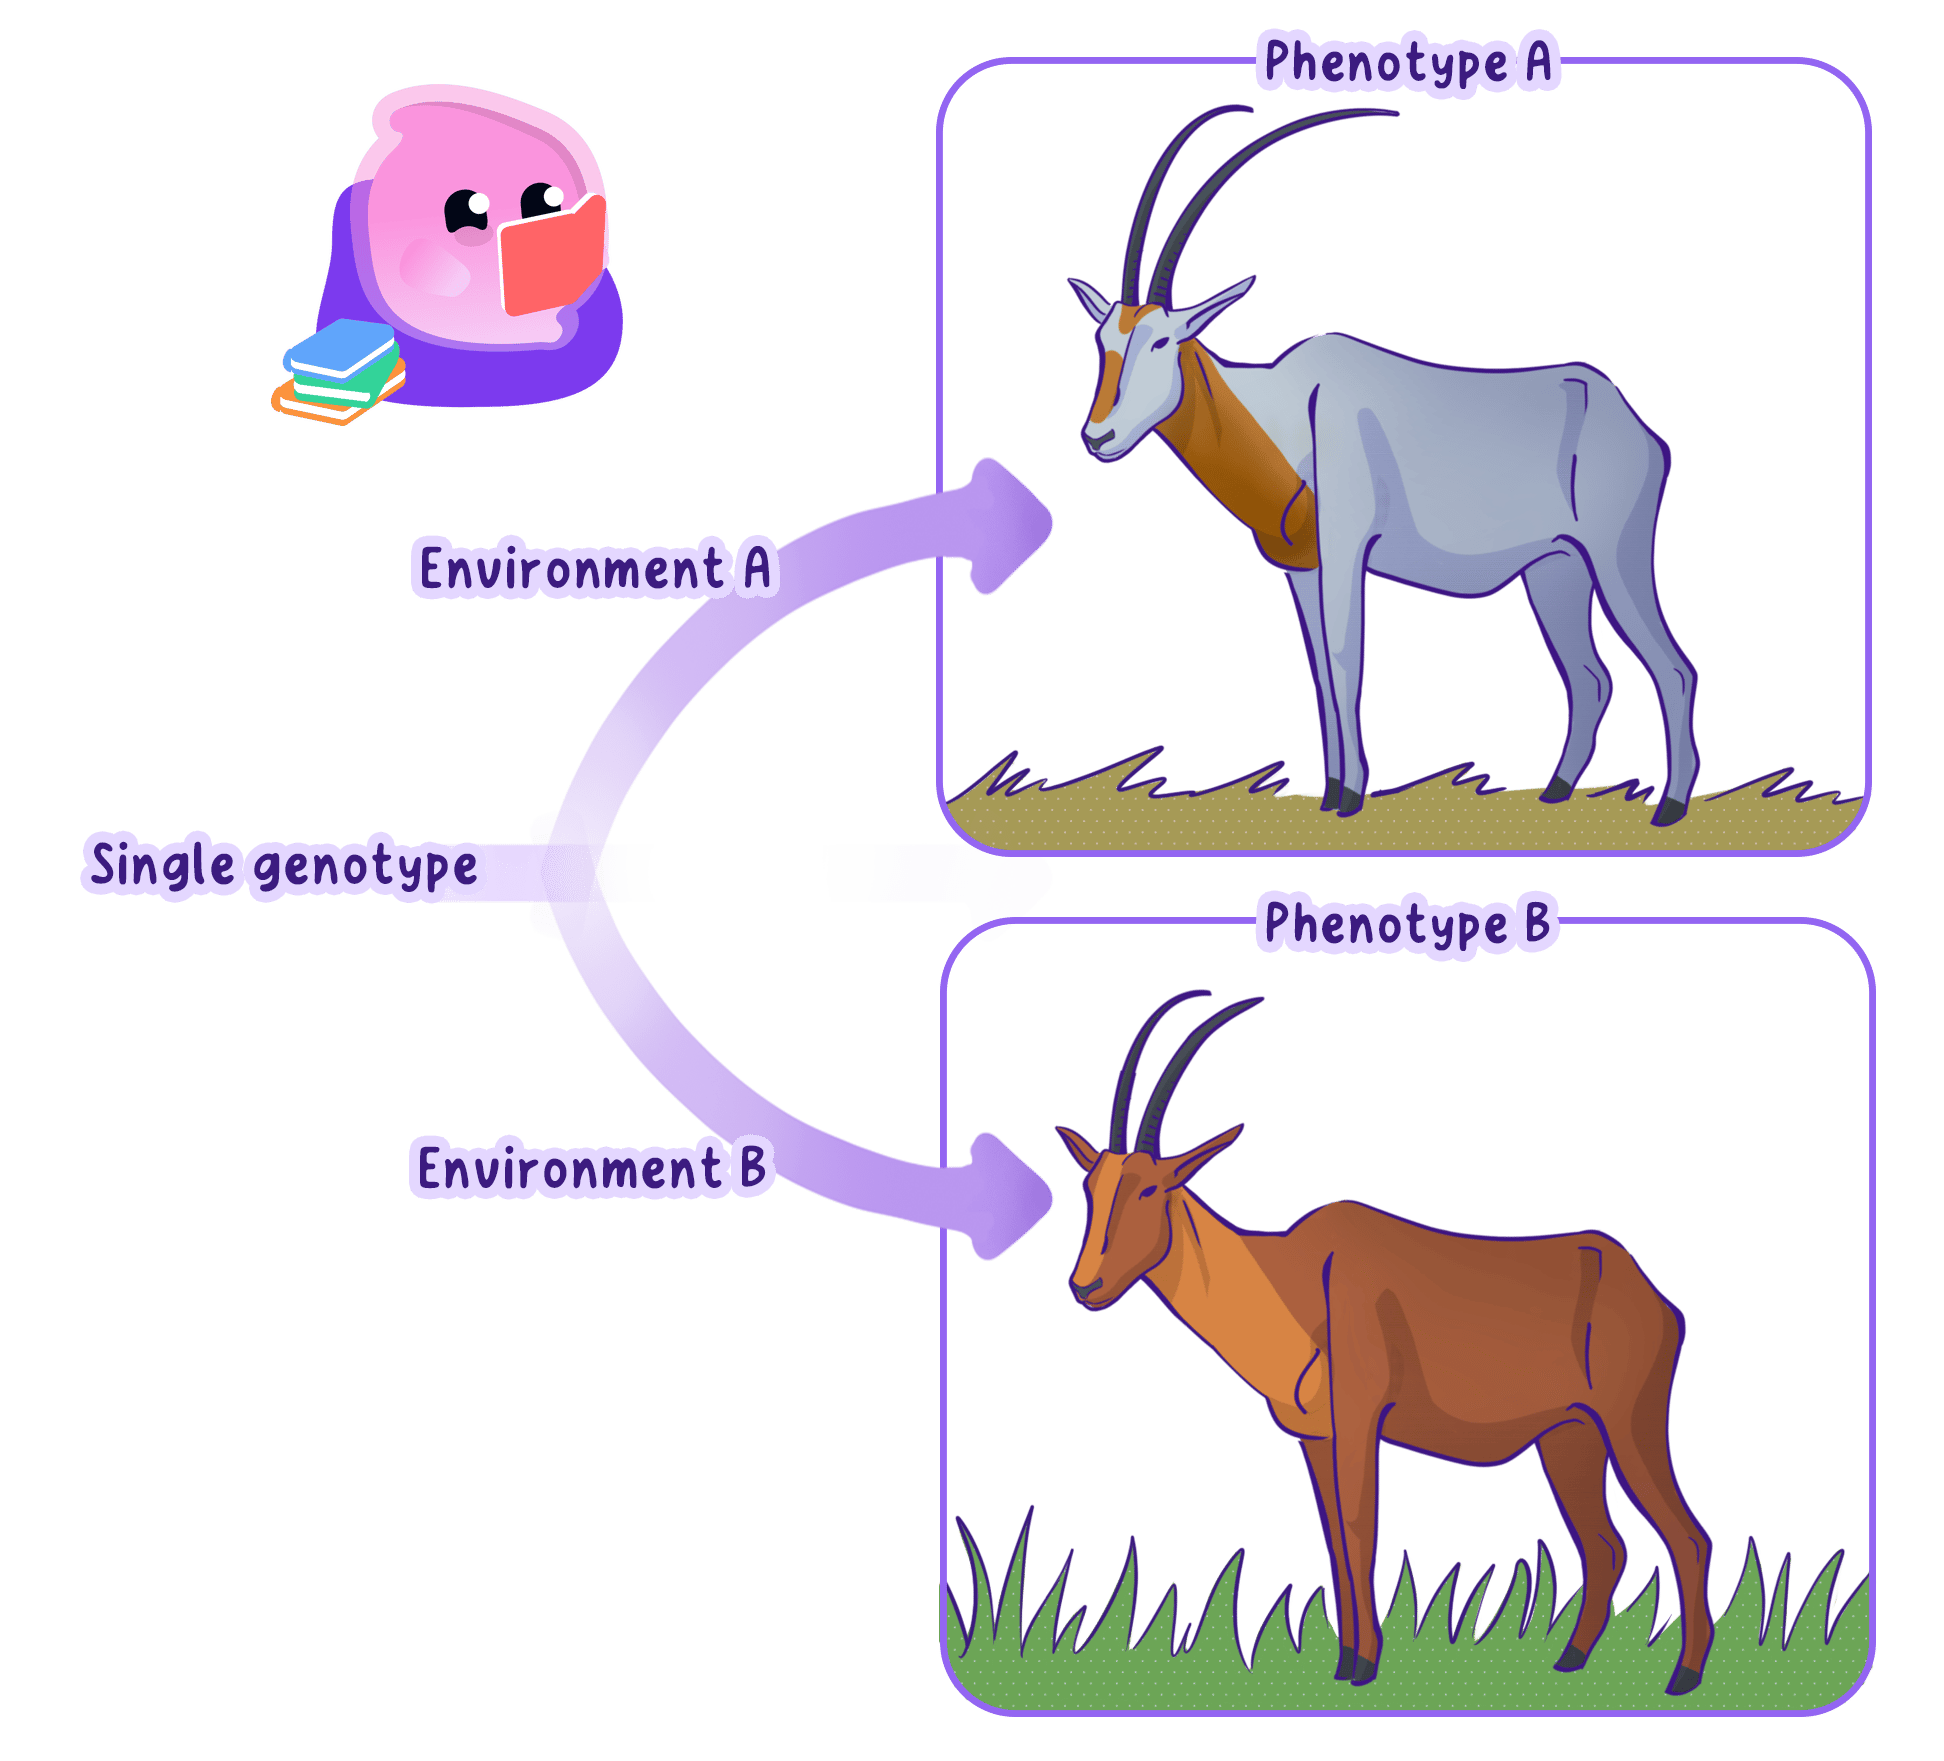
The phenotype is the observable or measurable characteristics of an organism produced by its genotype and its interaction with the environment.
Definition
Variation
Variation is the differences in characteristics between individuals of the same species.
- An organism's phenotype develops through the interaction of its genome with its environment.
- Genetic differences arise because individuals inherit different alleles, while environmental differences arise from different conditions or experiences.
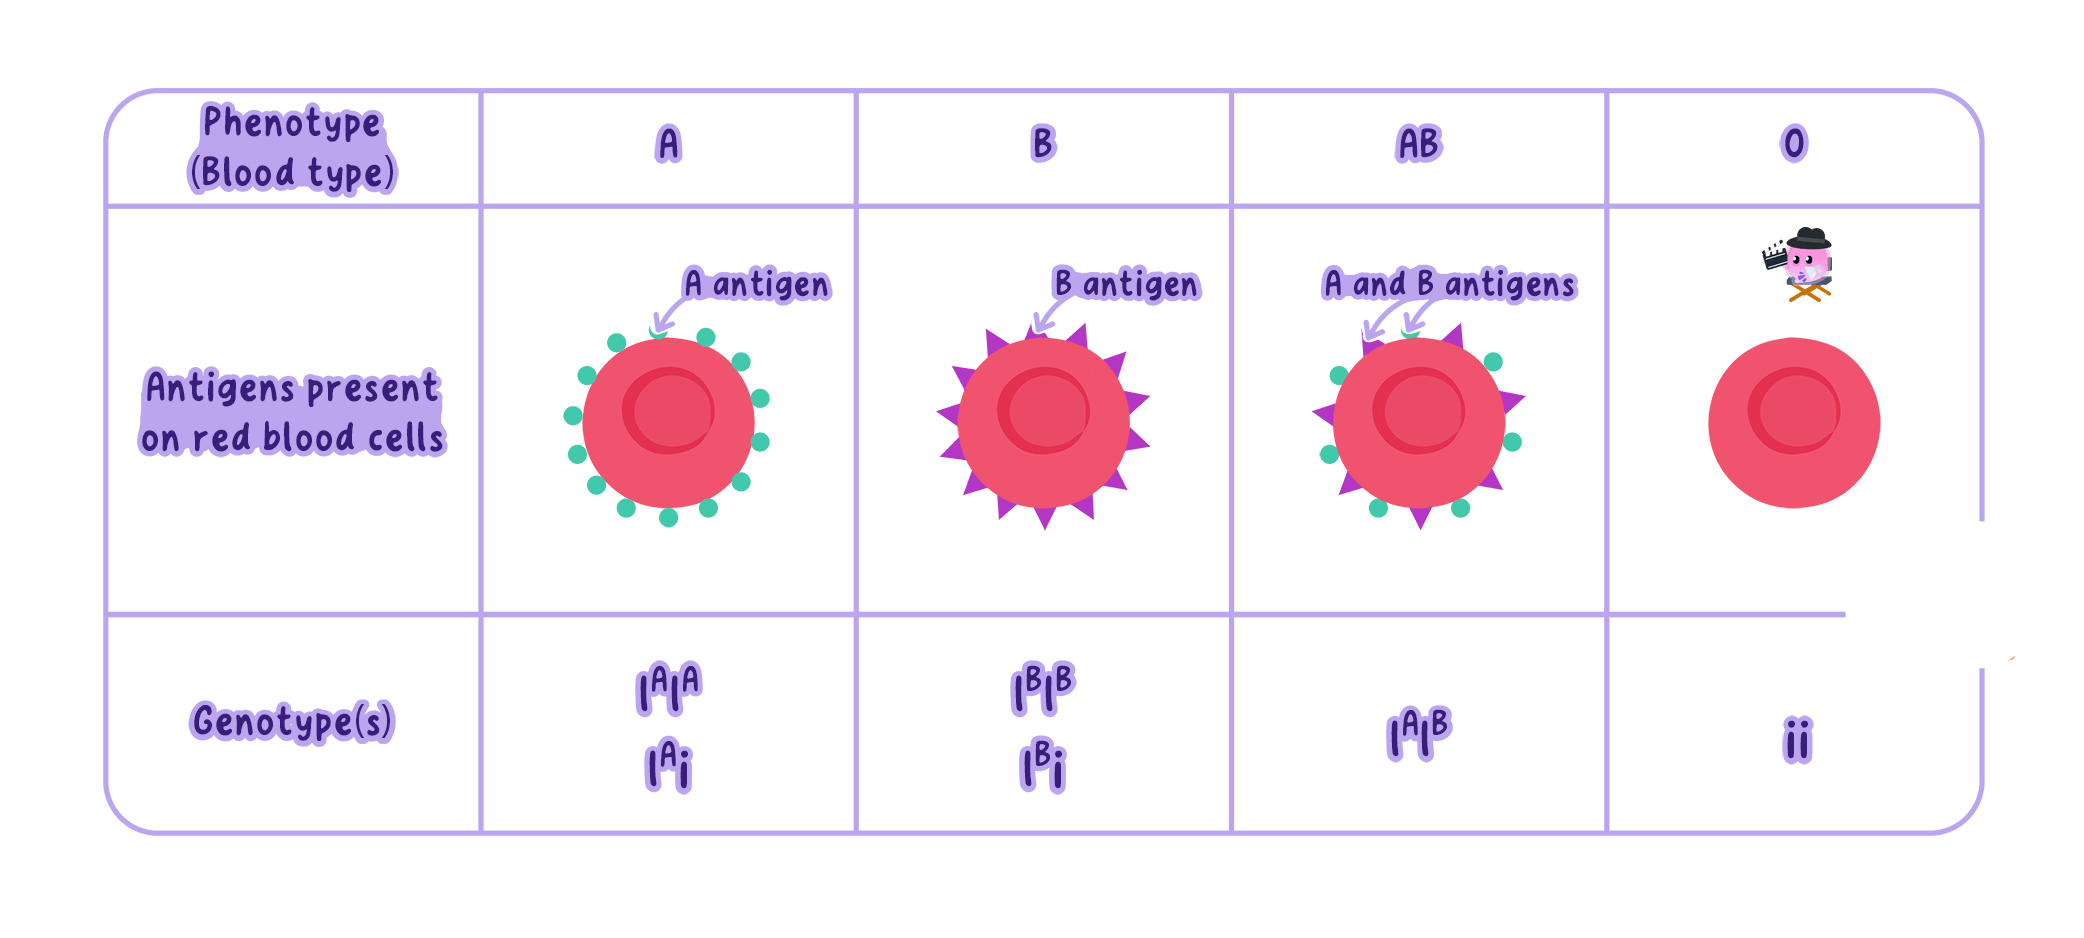
- Blood group is an example of a characteristic largely determined by inherited alleles.
- A scar is an acquired feature resulting from an injury and healing, rather than a new allele inherited from a parent.
- Height depends on inherited factors and on conditions during growth, including nutrition and illness.
- Body mass is influenced by inherited factors together with food intake, physical activity and other environmental conditions.
- Plant growth depends on inherited characteristics together with the supply of light, water and mineral ions.
Example
- Two genetically identical cuttings are grown with different supplies of mineral ions.
- The cutting with insufficient nitrate ions makes less protein for growth and may develop less biomass.
- A difference between their growth therefore need not indicate a difference in their inherited alleles.
Comparing environmental effects
- Identical twins have almost identical genomes but may develop different body masses or other characteristics when their experiences differ.
- Clones are useful for investigating environmental effects because their inherited genetic differences are greatly reduced.
- If genetically similar organisms develop different phenotypes under different conditions, this supports an environmental influence.
- A fair comparison changes the environmental factor of interest while keeping other relevant conditions the same.
- Simply finding a correlation between a condition and a characteristic does not prove that the condition caused the difference.
Practical
Investigating plant growth
- Aim: investigate how the supply of mineral ions affects the growth of genetically similar plants.
- Apparatus: use rooted cuttings from one parent plant, labelled pots, an inert growing medium, complete nutrient solution, a matching solution lacking nitrate ions, a measuring cylinder and a ruler.
- Method, setting up the plants:
- Select cuttings of similar initial height and root development, then randomly allocate several cuttings to each treatment.
- Provide one group with complete nutrient solution and the other with a solution lacking nitrate ions, keeping the other mineral concentrations the same.
- Use at least five cuttings in each treatment and grow them for a fixed period such as 212121 days.
- Give every pot the same volume of solution and keep pot size, growing medium, light exposure, temperature and growth period the same.
- Method, measuring and recording:
- Record initial shoot height from the growing-medium surface to the shoot tip and repeat the measurement at regular intervals using the same method.
- Measure shoot height at the start and every 333 days, recording each plant separately so its change can be followed.
- Record heights and height increases in mm\mathrm{mm}mm, together with observations such as leaf colour.
- Use several plants in each group and calculate each plant's increase in height before comparing the group means.
- Results: a consistent difference between the treatment means supports an effect of nitrate supply on phenotype.
- Watch out: compare the spread of results because a small difference between means may reflect variation among individual plants.
- Safety: handle solutions as instructed, avoid skin and eye contact, and wash hands after working with plants and growing media.
Continuous and discontinuous variation
Definition
Continuous variation
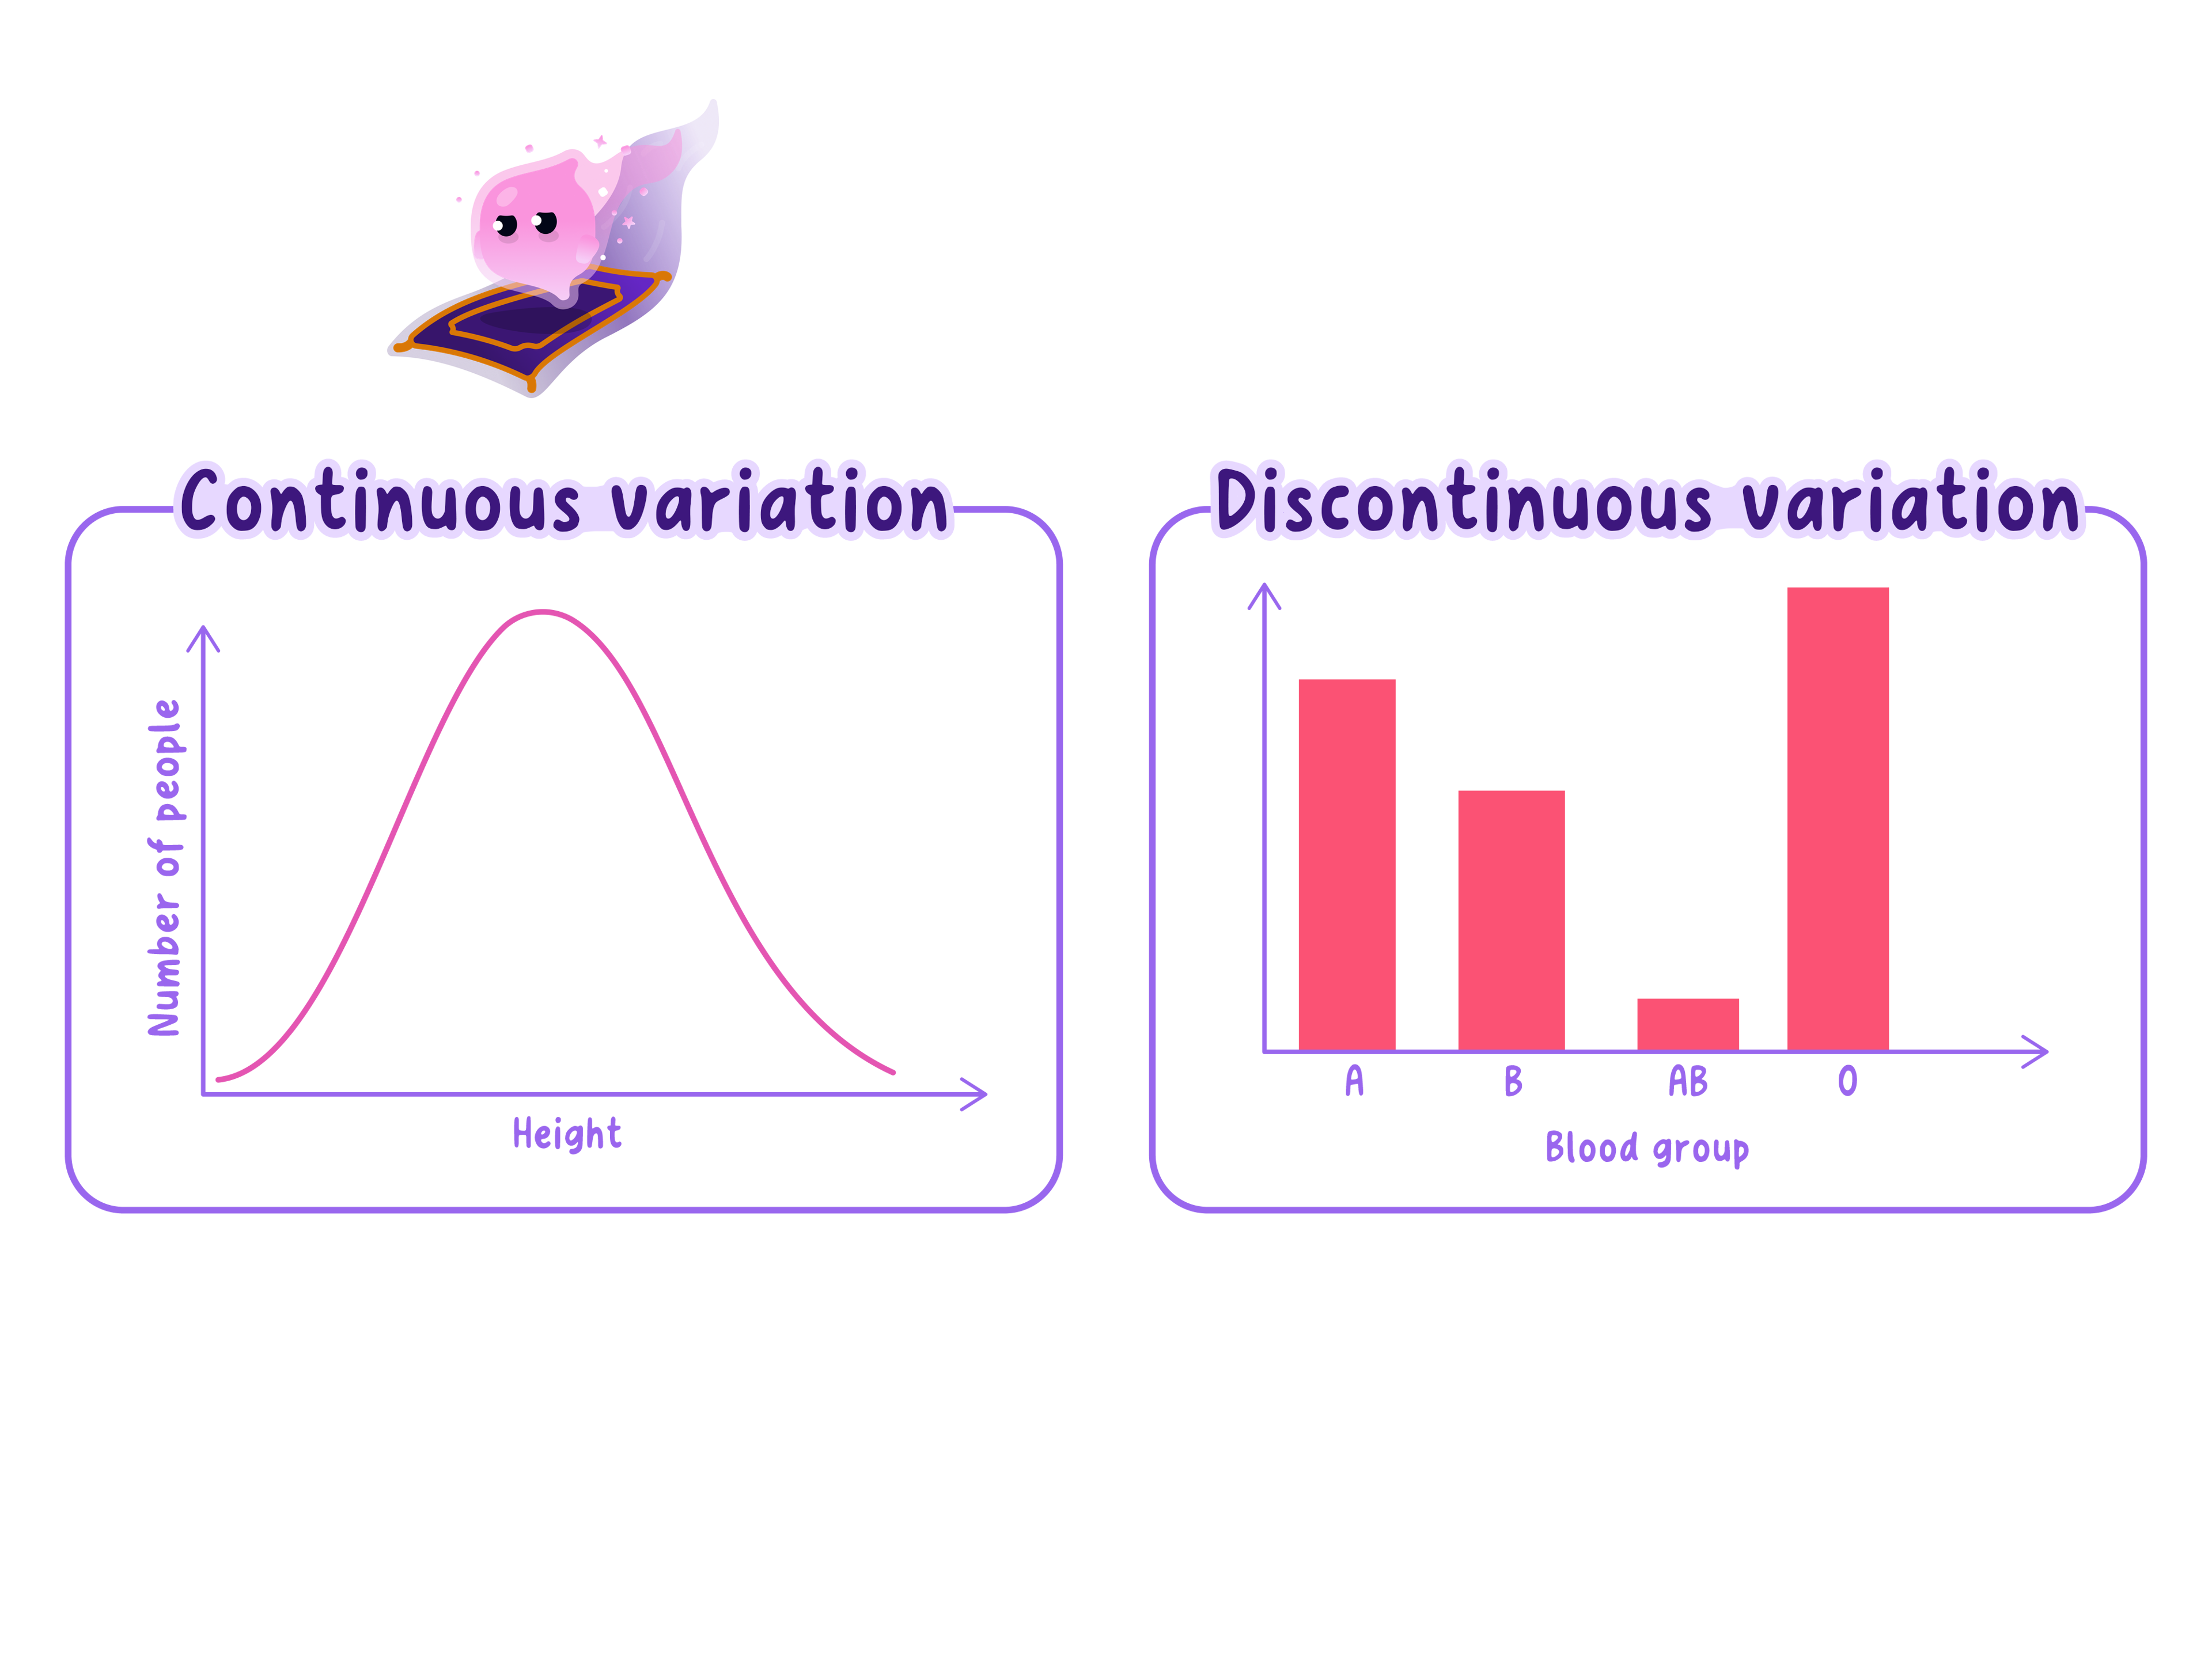
Continuous variation is variation in a characteristic across a range with intermediate values and no distinct categories.
Definition
Discontinuous variation
Discontinuous variation is variation in which a characteristic falls into distinct categories without intermediate values.
- Continuous variation produces a range of measurements with intermediate values, such as height, body mass or leaf length.
- Recording height to the nearest centimetre does not make height discontinuous, because the gaps arise from measurement precision.
- Discontinuous variation produces distinct categories, such as the blood groups A\mathrm{A}A, B\mathrm{B}B, AB\mathrm{AB}AB and O\mathrm{O}O.
- Eye colour can be recorded in categories for a survey, although real iris colour contains finer variation within those categories.
- The pattern of variation and the cause of variation are different questions, so continuous does not mean environmental and discontinuous does not mean unaffected by the environment.
Exam technique
Justify continuous using the range and intermediate values, or discontinuous using distinct categories, rather than naming only an example.
Displaying variation
- For continuous measurements, group values into equal-width intervals and draw a histogram with touching bars.
- Many large samples show values clustered near the middle with fewer at the extremes, but continuous data do not have to form a perfectly symmetrical bell shape.
- For categorical data, draw a bar chart with a separate bar for each category and gaps between bars.
- Label the horizontal axis with the measured characteristic and units or the category names, and label the vertical axis with frequency.
Practical
Investigating variation
- Aim: compare continuous hand-span measurements with a discontinuous characteristic recorded from anonymous, supplied blood-group data.
- Apparatus: millimetre ruler, paper and anonymous supplied blood-group data.
- Method, selecting the sample:
- Choose volunteers randomly from the defined group and include a sufficiently large sample to reduce the effect of chance.
- Use anonymous codes, obtain consent and allow volunteers to withdraw without giving a reason.
- Method, measuring hand span:
- Ask each volunteer to place the same hand flat on paper and comfortably spread the fingers without straining.
- Measure the straight-line distance from the tip of the thumb to the tip of the little finger with a millimetre ruler.
- Use the same ruler, measuring method and hand throughout, and record relevant differences in age when comparing groups.
- Repeat each measurement using the same hand position and calculate a mean hand span for each volunteer.
- Results: group hand-span values into equal-width intervals for a histogram and count the supplied blood-group categories for a bar chart.
- Watch out: a class sample may not represent the wider population, even when every measurement is precise.
- Safety: use supplied blood-group records rather than collecting or testing blood.
Calculating a mean
- Calculate a mean by dividing the sum of the measurements by the number of measurements: mean=sum of measurementsnumber of measurements\text{mean}=\dfrac{\text{sum of measurements}}{\text{number of measurements}}mean=number of measurementssum of measurements.
- Retain the original measurement unit and inspect the spread as well as the mean when comparing samples.
Example
- Hand spans in a small illustrative sample are 160160160, 170170170, 175175175, 180180180 and 190 mm190\,\mathrm{mm}190mm.
- Their total is 160+170+175+180+190=875 mm160+170+175+180+190=875\,\mathrm{mm}160+170+175+180+190=875mm.
- The mean is 8755=175 mm\dfrac{875}{5}=175\,\mathrm{mm}5875=175mm.
- The range is 190−160=30 mm190-160=30\,\mathrm{mm}190−160=30mm, which describes the difference between the largest and smallest measurements.
Self review
- Why can genetically identical plants develop different heights?
- What distinguishes continuous variation from discontinuous variation?
- Why does rounding a measurement not make the characteristic discontinuous?
- Why are clones useful in an environmental investigation?
- Which graph displays blood-group categories?
