Question 5
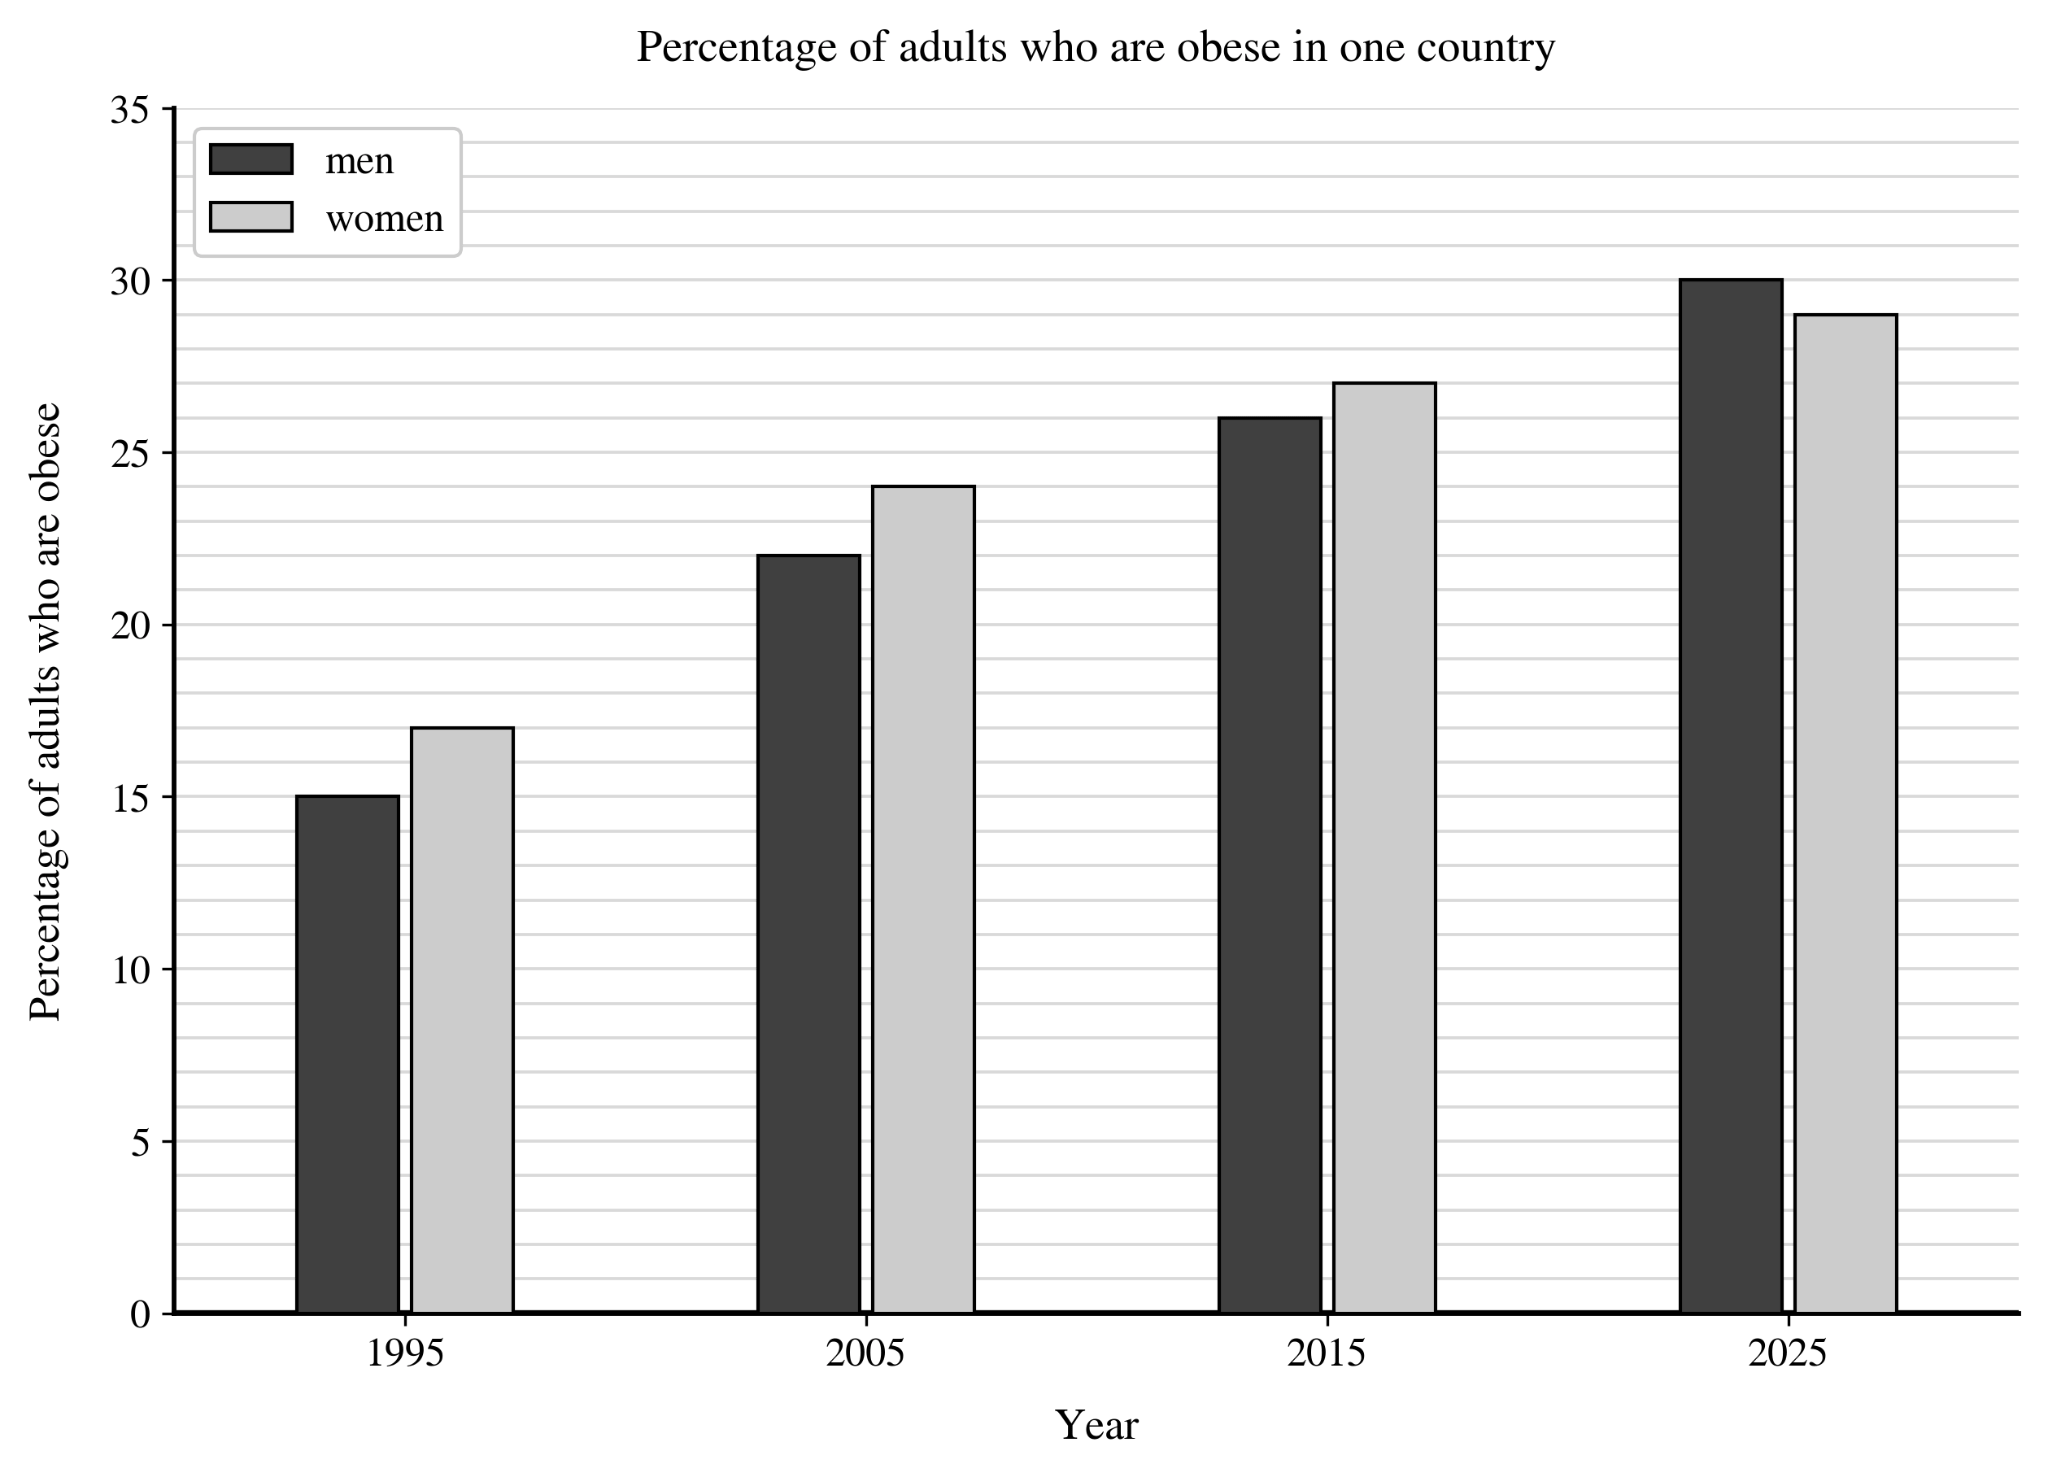
FThe Figure shows the percentage of adults who are obese in one country.
Figure
a.[1]
Give the first year shown in which the percentage of obese men was greater than the percentage of obese women.
b.[2]
Calculate the percentage increase in obese men between 1995 and 2025.
c.[2]
Suggest two lifestyle reasons for the change shown in the Figure.
d.[2]
Explain how the change shown in the Figure could affect the country at a national level.
5.4 Non-communicable diseases Questions
44 exam-style questions on Edexcel GCSE Biology 5.4 Non-communicable diseases, covering 5.4.1 Interaction of factors in non-communicable disease, 5.4.2 Lifestyle factors and non-communicable disease, and 5.4.3 Treatments for cardiovascular disease. Each one has a worked solution and a mark scheme showing where the marks go.