Question 2
FA health visitor measured the mass of a baby boy from birth until he was 6 months old.
The Table shows the results.
Table
| Age in months | Mass in kg\text{kg}kg |
|---|---|
| 0 | 3.4 |
| 2 | 5.1 |
| 4 | 6.0 |
| 6 | 6.4 |
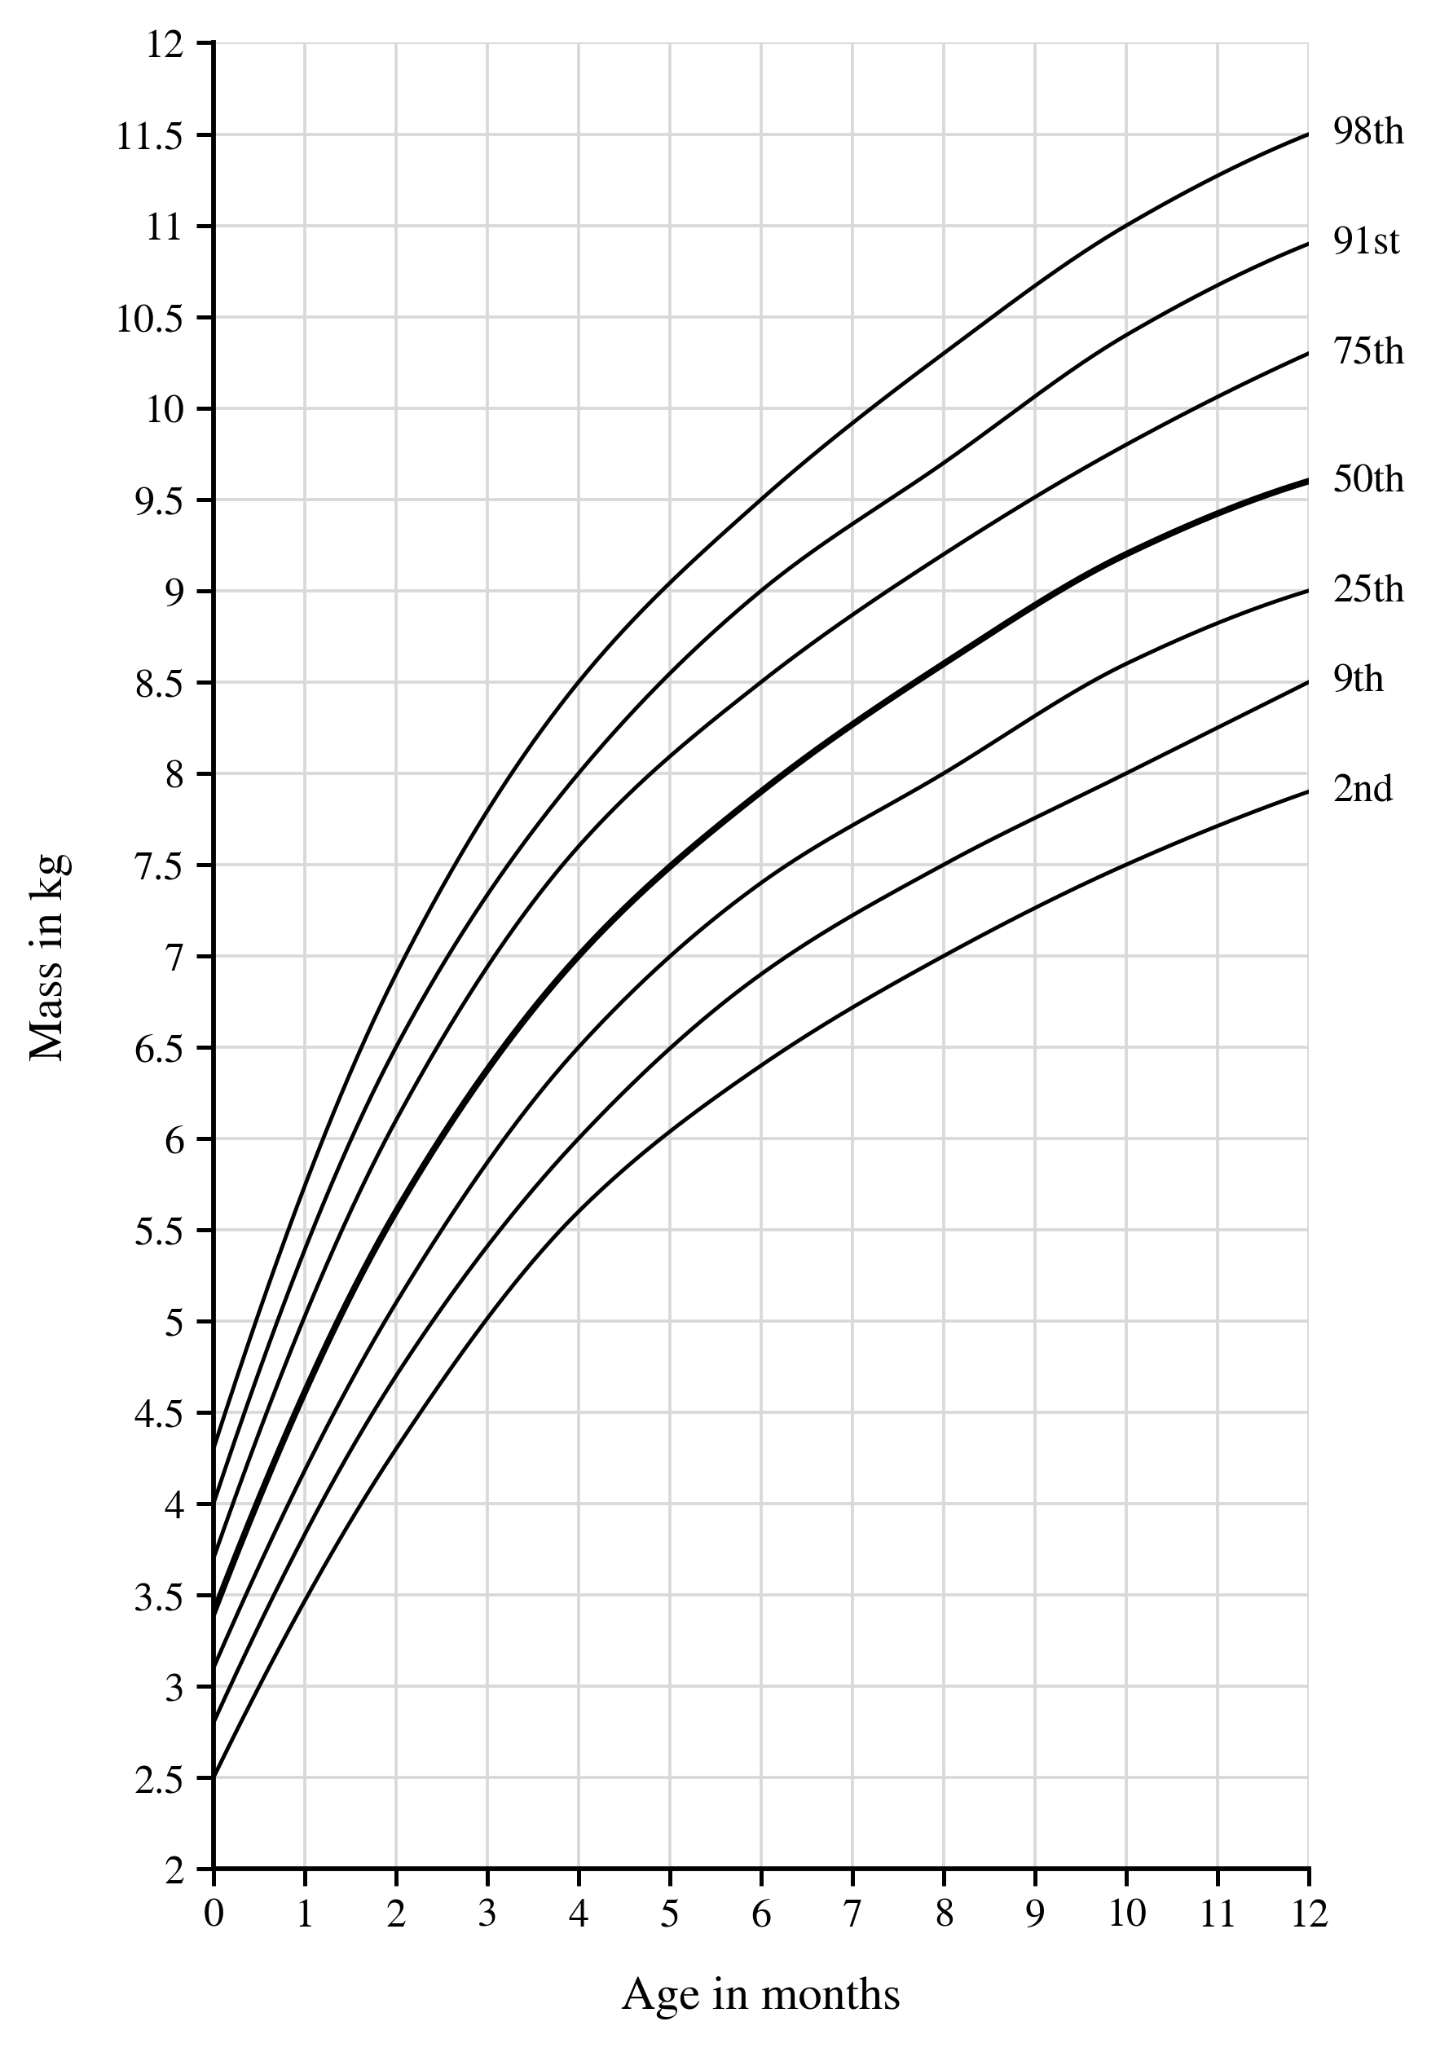
The Figure shows a percentile chart for the mass of baby boys.
Figure
a.[1]
Use the Table and the Figure to give the percentile for the baby's mass at birth.
b.[1]
Calculate the increase in the baby's mass from birth to 6 months.
c.[2]
Describe how the baby's mass changed compared with the percentile lines over the first 6 months.
d.[2]
Explain why a doctor would be concerned about the growth of this baby.
2.1 Cell division and growth Questions
42 exam-style questions on Edexcel GCSE Biology 2.1 Cell division and growth, covering 2.1.1 Mitosis and the cell cycle, 2.1.2 Division producing identical daughter cells, 2.1.3 Cancer and uncontrolled cell division, 2.1.4 Growth in animals and plants, 2.1.5 Importance of cell differentiation, and 2.1.6 Percentile charts to monitor growth. Each one has a worked solution and a mark scheme showing where the marks go.