Question 23
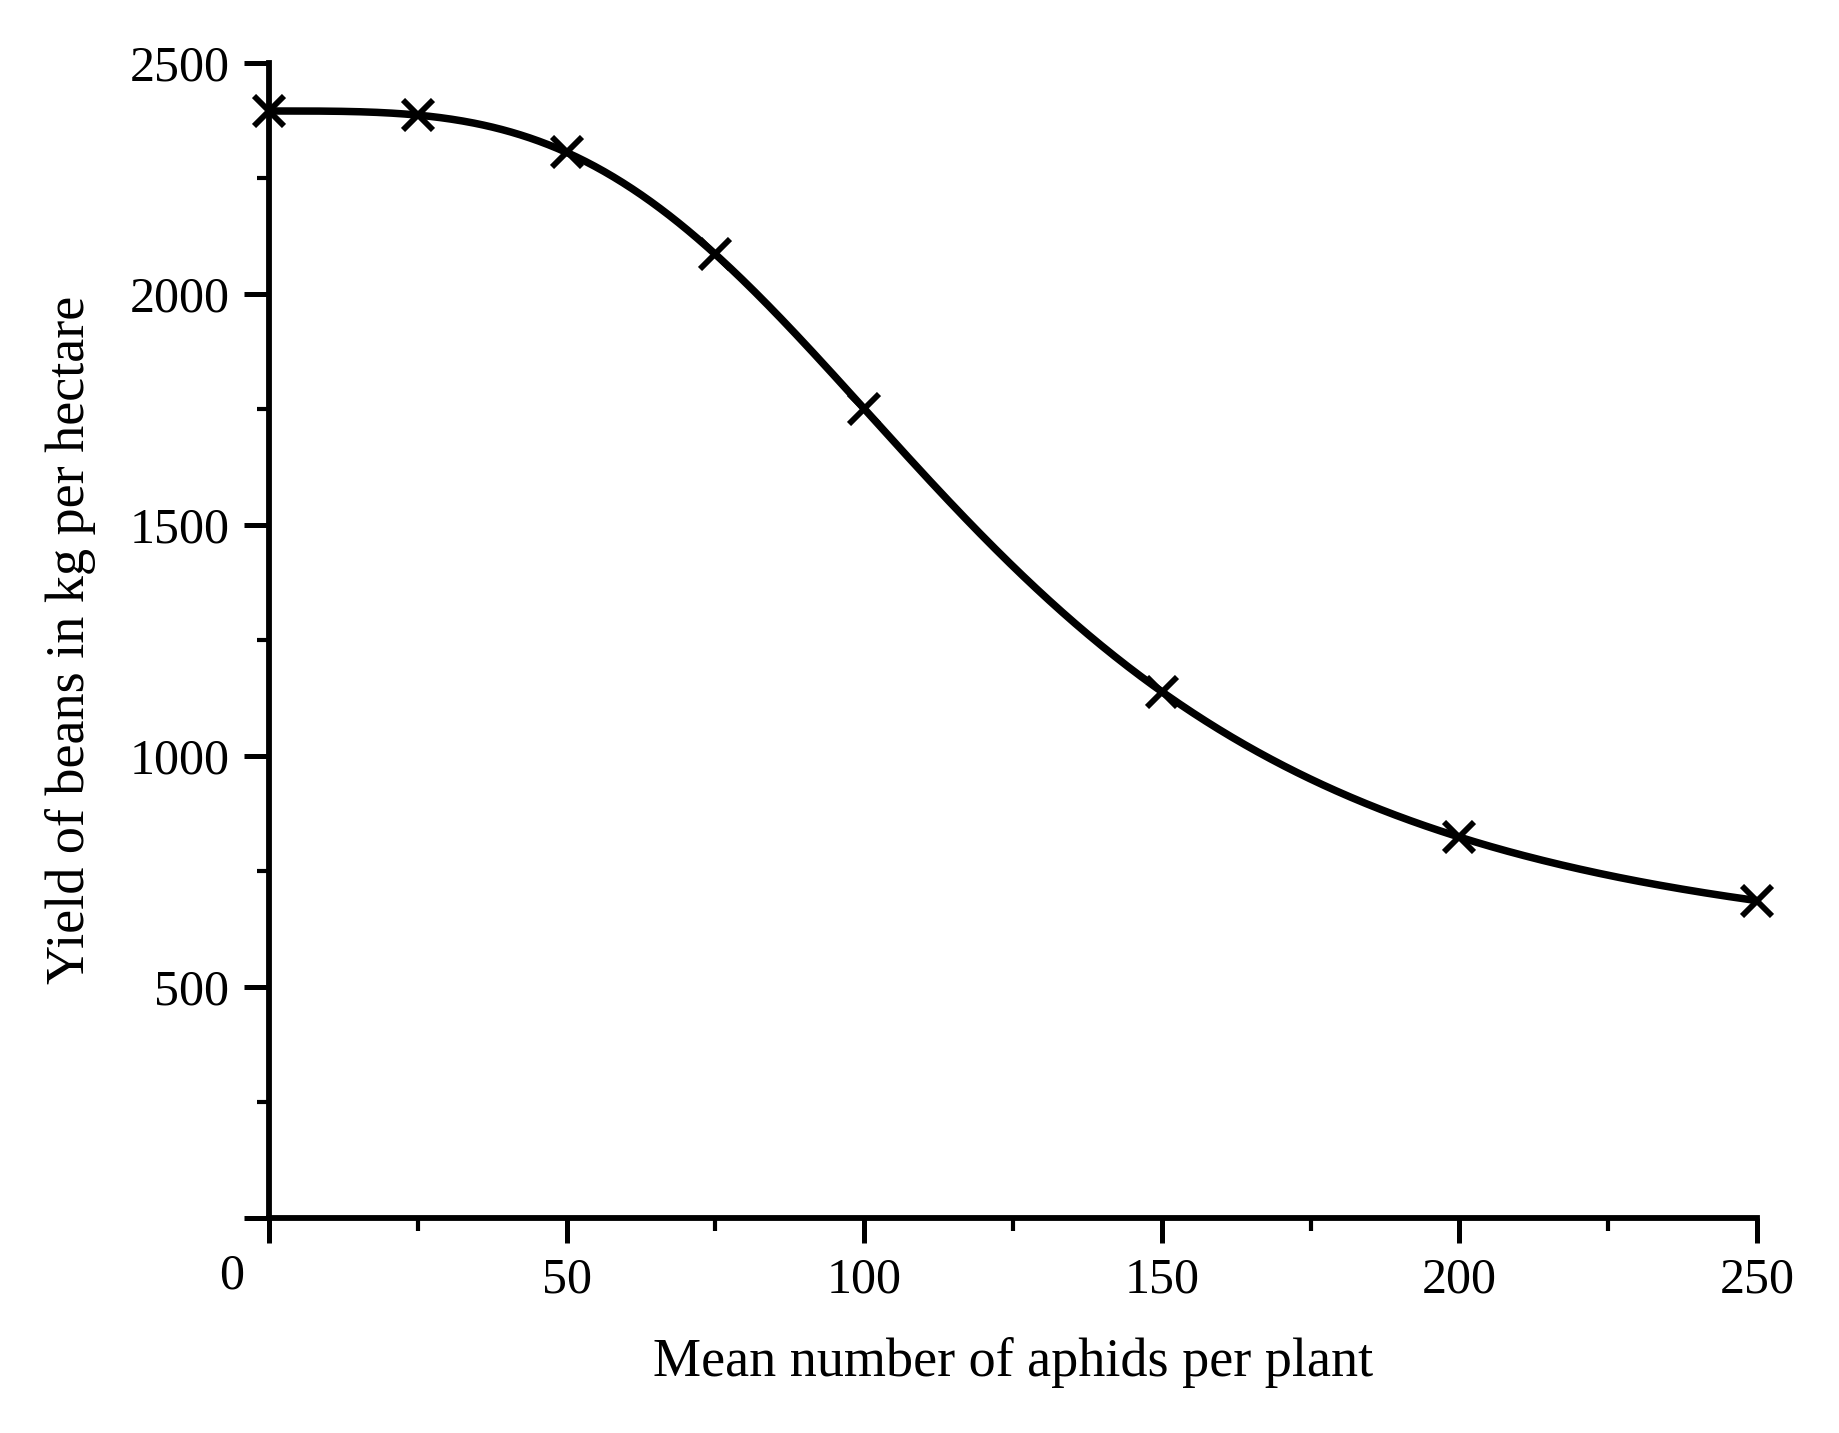
FA scientist investigated the effect of the number of aphids on the yield of a bean crop. The figure shows the scientist's results.
Figure: The yield of a bean crop plotted against the mean number of aphids per bean plant
a.[3]
Describe the relationship shown in the figure. Use data from the figure in your answer.
b.[1]
A grower has a mean of 30 aphids per bean plant. Suggest why the grower may decide not to treat this crop with a pesticide.
3.3 Plant disease Questions
57 exam-style questions on AQA GCSE Biology 3.3 Plant disease, covering 3.3.1 Detection and identification of plant diseases and 3.3.2 Plant defence responses. Each one has a worked solution and a mark scheme showing where the marks go.