What you'll learn
- What primary data and secondary data mean in psychological research.
- How to tell the difference between data collected first-hand and data that already exists.
- What a meta-analysis is and why psychologists use it.
- How to evaluate primary data, secondary data, and meta-analysis for AO3.
Starting point: what is data?
In psychology, data means the information researchers collect or use to answer a research question. Data might be numerical, such as reaction times or questionnaire scores, or descriptive, such as interview responses or observation notes.
Data
Data are pieces of information used as evidence in research. In psychology, data can be quantitative — numerical — or qualitative — non-numerical and descriptive.
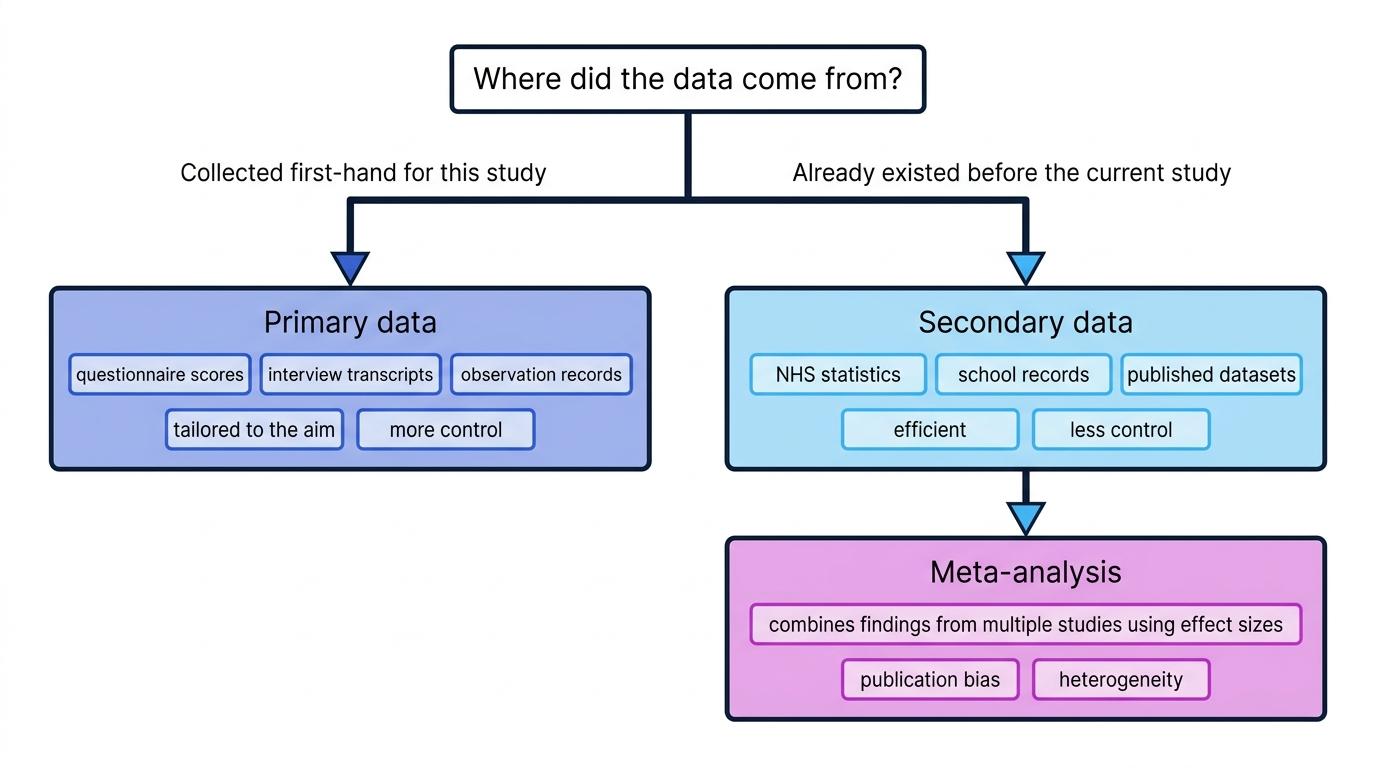
Before you evaluate a study, you need to ask: where did the data come from? That is where the distinction between primary and secondary data matters.
Primary data
Primary data
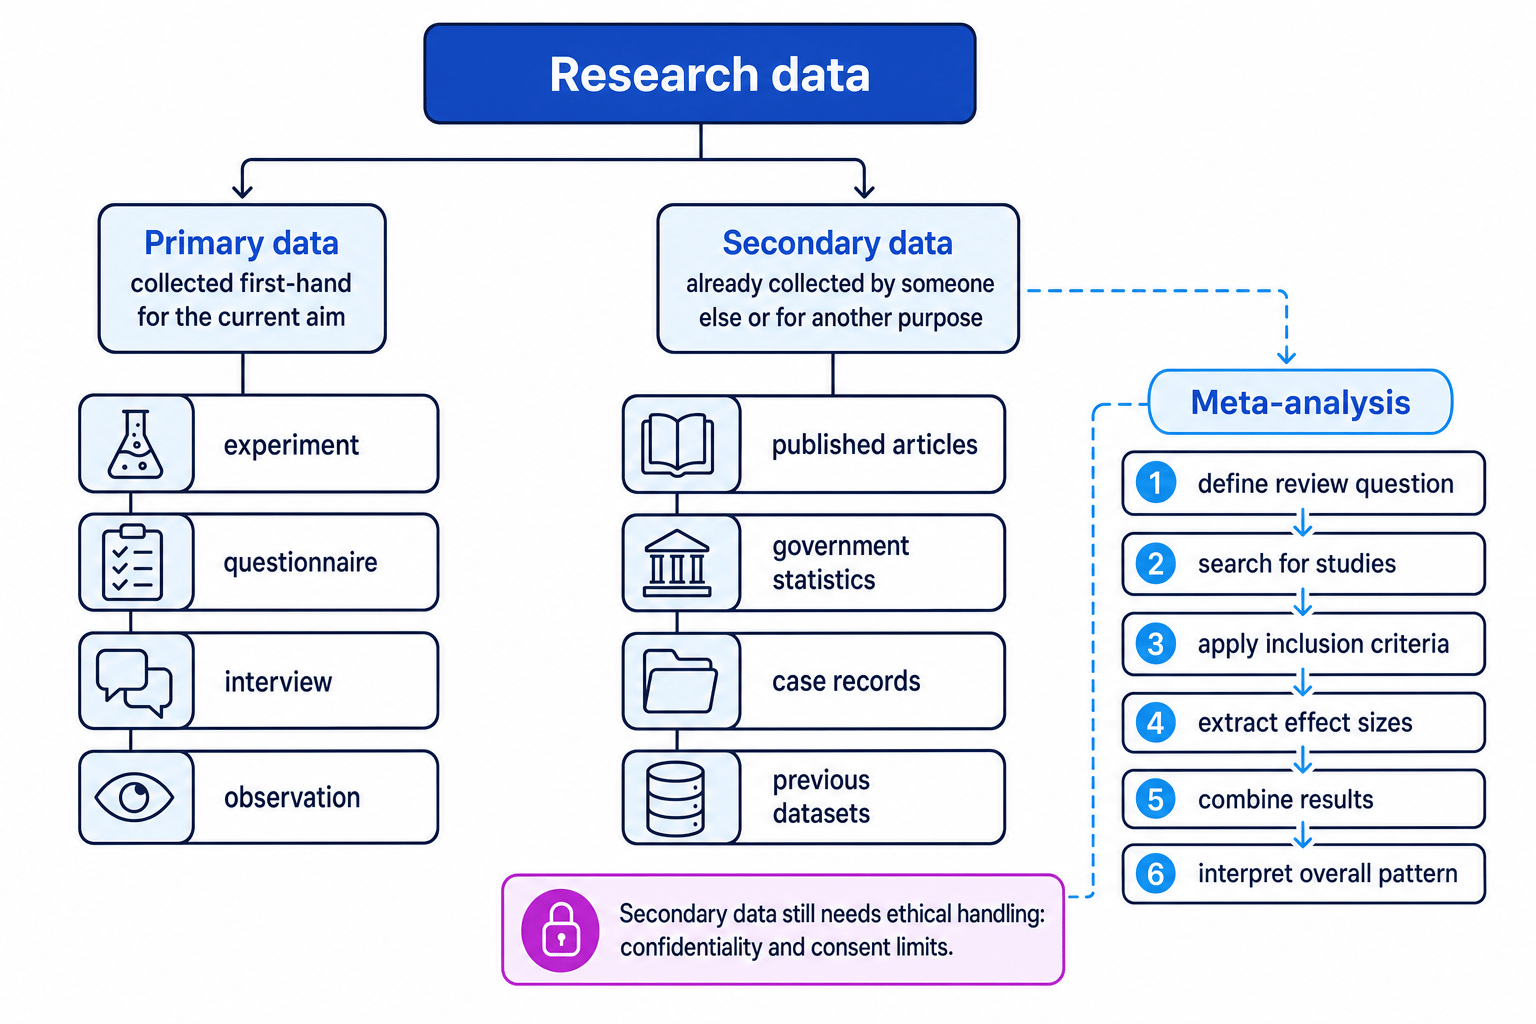
Primary data are data collected first-hand by the researcher for the specific aims of their current study.
Primary data are “new” in the sense that the researcher gathers them directly. In psychology, this could include:
- scores from a laboratory experiment
- questionnaire responses
- interview transcripts
- observation records
- physiological measures such as heart rate or brain activity
For example, in Loftus and Palmer’s 1974 study on eyewitness testimony, participants watched film clips of car accidents and estimated the speed of the cars. The speed estimates were primary data because Loftus and Palmer collected them directly for that study.
Why researchers use primary data
Primary data are useful because they can be designed to match the researcher’s exact aim — the purpose of the study.
If a researcher wants to investigate whether sleep affects memory recall, they can design a study with the exact sleep conditions, memory task, sampling method, and procedure they need.
Primary data gives control
The main strength of primary data is control: the researcher can decide what to measure, how to measure it, who to test, and when to collect the data.
Strengths of primary data
Primary data are often highly relevant because they are collected for the exact research question. The researcher can carefully operationalise variables, meaning they define abstract concepts in measurable terms.
Operationalisation
Operationalisation means turning a concept into something measurable. For example, “memory” could be operationalised as the number of words correctly recalled from a list.
Primary data also allow researchers to standardise procedures. This helps improve reliability, meaning consistency. If all participants receive the same instructions and complete the same task, differences in results are less likely to be caused by procedural variation.
Limitations of primary data
Primary data can be expensive and time-consuming. Recruiting participants, designing materials, gaining ethical approval, collecting responses, and analysing results all take effort.
Primary data can also be affected by participant behaviour. For example, participants may show demand characteristics, where they guess the aim of the study and change their behaviour.
Demand characteristics
Demand characteristics are cues in a study that lead participants to guess the research aim and behave differently as a result.
Primary data may also lack generalisability if the sample is small, biased, or unrepresentative.
Ethics and primary data
When researchers collect primary data from people, they must follow ethical guidelines. These include:
- gaining informed consent
- avoiding unnecessary deception
- giving participants the right to withdraw
- protecting participants from psychological or physical harm
- maintaining confidentiality
- providing a full debrief
In Loftus and Palmer’s 1974 study, participants watched accident footage. This raises mild protection-from-harm issues because the clips could have caused distress, although the risk was relatively low compared with real-life trauma research. Participants should also have been debriefed about the purpose of the study.
Classifying primary data
A researcher wants to study whether background music affects concentration. They recruit 40 students, give them a concentration task, and record their scores.
- The current research aim is to test the effect of background music on concentration.
- The researcher personally collects the concentration scores from participants.
- The scores are collected specifically for this study, not reused from an earlier source.
- Therefore, the concentration scores are primary data.
Secondary data
Secondary data
Secondary data are data that already exist before the current research begins, usually collected by someone else or for a different purpose.
Secondary data can include:
- published journal articles
- government statistics
- school or hospital records
- historical documents
- previous experimental datasets
- case notes
- archived interviews or observations
For example, a psychologist studying mental health trends might use NHS statistics rather than collecting new data from patients. Those statistics would be secondary data.
Why researchers use secondary data
Secondary data are useful when collecting new data would be impractical, unethical, expensive, or impossible.
For instance, researchers cannot go back in time to collect childhood records from past decades. Instead, they may use archived documents, medical records, or previous research.
Secondary data saves time
The main strength of secondary data is efficiency: it allows researchers to use information that has already been collected, often from large samples or long time periods.
Strengths of secondary data
Secondary data can provide access to large-scale information. Government statistics or national surveys may include thousands of participants, improving generalisability.
Secondary data can also be valuable for studying rare behaviours, historical changes, or long-term patterns. For example, researchers interested in changes in diagnosis rates over time may use existing clinical records rather than starting from scratch.
Secondary data can reduce participant burden because researchers do not need to ask people to take part again.
Limitations of secondary data
The biggest weakness is that the data may not perfectly match the researcher’s aim. Another researcher may have used different definitions, measures, samples, or procedures.
There may also be unknown problems with reliability or validity. If the original data were collected poorly, the new researcher inherits those weaknesses.
Primary does not mean better
Do not write that primary data are always better than secondary data. Primary data often give more control, but secondary data may have larger samples, longer time spans, or stronger real-world relevance.
Secondary data may also be outdated. For example, old statistics on attitudes to mental illness may not reflect current social norms.
Ethics and secondary data
Secondary data still involve ethical issues. Even if the current researcher does not meet participants, the data may contain sensitive information.
Researchers should consider whether the original participants consented to their data being reused. They must protect confidentiality, anonymise records where needed, and avoid using data in ways that could harm individuals or groups.
Classifying secondary data
A researcher wants to investigate whether rates of anxiety have increased among teenagers over the last 20 years. They download published NHS statistics and compare yearly diagnosis rates.
- The researcher’s current aim is to examine changes in teenage anxiety over time.
- The researcher does not collect new anxiety scores directly from teenagers.
- The NHS statistics already existed before the current study began.
- Therefore, the NHS statistics are secondary data.
Comparing primary and secondary data
The difference is not about whether data are numerical or descriptive. Both primary and secondary data can be quantitative or qualitative.
For example, a researcher’s own interview transcripts are primary qualitative data. Archived interview transcripts collected by another researcher are secondary qualitative data.
A simple question helps:
The source test
Ask: Were these data collected first-hand for this exact study? If yes, they are primary data. If no, they are probably secondary data.
Meta-analysis
Meta-analysis
A meta-analysis is a statistical technique that combines the findings of multiple studies on the same topic to identify an overall pattern or effect.
Meta-analysis is a form of secondary data analysis because it uses results from studies that have already been carried out.
It is often part of a systematic review, which is a carefully planned review of research using clear search terms, databases, and inclusion criteria.
Inclusion criteria
Inclusion criteria are the rules researchers use to decide which studies will be included in a review or meta-analysis.
For example, a meta-analysis on attachment might include only studies that used the Strange Situation procedure, included infants under two years old, and reported attachment classifications clearly.
How meta-analysis works
A meta-analysis usually follows these steps:
- Researchers define a clear research question.
- They search for relevant studies.
- They apply inclusion and exclusion criteria.
- They extract key findings from each study.
- They convert findings into a common measure, often an effect size.
- They statistically combine the results.
- They interpret the overall pattern.
Effect size
An effect size is a numerical measure of the strength of a relationship or difference. It helps researchers judge how large an effect is, not just whether it is statistically significant.
A study might find a statistically significant result at p<0.05p < 0.05p<0.05, but the effect could still be small. Meta-analysis helps researchers look beyond one study and consider the overall strength of the evidence.
Example from psychology
A well-known example is van IJzendoorn and Kroonenberg’s 1988 meta-analysis of cross-cultural attachment studies. They combined findings from 32 studies using the Strange Situation across several countries.
They found that secure attachment was the most common classification across cultures. However, variation within cultures was often greater than variation between cultures.
This is useful because one small study in one country may give a narrow picture, whereas a meta-analysis can identify broader patterns.
Planning a meta-analysis
A psychologist wants to find out whether cognitive behavioural therapy reduces symptoms of phobia.
- They define the question precisely: whether CBT reduces phobia symptoms compared with a control condition or another treatment.
- They search databases for studies using CBT with phobia patients and record the search terms used.
- They apply inclusion criteria, such as only including peer-reviewed studies with a standardised phobia symptom measure.
- They extract effect sizes from each study so the results can be compared on a common scale.
- They combine the effect sizes to estimate the overall impact of CBT on phobia symptoms.
Strengths of meta-analysis
Meta-analysis can increase confidence in conclusions because it combines many studies rather than relying on one sample. This usually gives greater statistical power, meaning a better chance of detecting a real effect if one exists.
It can also help resolve contradictory findings. If some studies find an effect and others do not, a meta-analysis may show whether the overall evidence supports the effect.
Meta-analysis is also useful for real-world application. For example, clinicians and policy-makers may prefer conclusions based on many studies rather than one isolated piece of research.
Meta-analysis looks for the bigger picture
A meta-analysis does not just list previous studies. It combines their findings to estimate the overall strength and direction of an effect.
Limitations of meta-analysis
A meta-analysis is only as good as the studies included. This is sometimes called the “garbage in, garbage out” problem. If the original studies have weak methods, biased samples, or poor measures, combining them does not magically fix those problems.
Meta-analyses can also suffer from publication bias.
Publication bias
Publication bias occurs when studies with significant or interesting findings are more likely to be published than studies with non-significant findings.
This matters because a meta-analysis based mainly on published studies may overestimate an effect. Non-significant studies may be hidden in researchers’ files, sometimes called the “file drawer problem”.
Another issue is heterogeneity, which means variation between studies. If studies use different procedures, samples, measures, or definitions, it may be difficult to combine them meaningfully.
Heterogeneity
Heterogeneity means that the studies being combined differ in important ways, such as their samples, methods, measures, or settings.
For example, combining studies of “stress” may be problematic if one study measures exam stress, another measures workplace stress, and another measures traumatic stress.
Combining studies is not always sensible
A meta-analysis can be misleading if the included studies are too different. Researchers must justify why the studies are similar enough to combine.
AO2: applying the distinction
In scenario questions, focus on the source and purpose of the data.
If a teacher gives pupils a new questionnaire for her current investigation, that is primary data. If she analyses old school attendance records, that is secondary data.
If a researcher combines published results from several studies of obedience, that is likely to be a meta-analysis.
Identifying a mixed-data study
A researcher interviews 20 patients about therapy experiences and also compares their responses with published national recovery statistics.
- The interview responses are collected directly by the researcher for the current aim, so they are primary data.
- The national recovery statistics already existed before the current research, so they are secondary data.
- Because the study uses both new interviews and existing statistics, it contains both primary and secondary data.
- The statistics are not automatically a meta-analysis because they are not necessarily a statistical combination of multiple study findings.
AO3: evaluation points for essays
For primary data, strong evaluation often focuses on control, relevance, reliability, ecological validity, cost, time, and ethical demands.
For secondary data, evaluate efficiency, access to large or historical datasets, lack of control over original methods, and whether the data fit the current aim.
For meta-analysis, evaluate increased power and broader conclusions against publication bias, poor-quality original studies, and heterogeneity.
Best comparison phrase
Use “whereas” to compare clearly: Primary data are tailored to the current aim, whereas secondary data may have been collected for a different purpose.
In the exam
- Define the term first: state clearly whether the data are collected first-hand or already exist.
- For AO2 scenarios, justify your answer using the source and purpose of the data, not just the type of method.
- For AO3, avoid one-sided answers: primary data give control but take time; secondary data are efficient but may not fit the research aim; meta-analysis gives a bigger picture but can be affected by publication bias.
Check yourself
- How would you decide whether a set of questionnaire responses is primary or secondary data?
- Why might a psychologist choose to use secondary data instead of collecting new data?
- What is one strength and one limitation of using a meta-analysis?