What you'll learn
- How to calculate the mean, median, mode, range and percentages.
- How to describe dispersion using the range and standard deviation.
- How to recognise positive, negative and zero correlations.
- How to choose the most appropriate descriptive statistic for a psychology data set.
Why descriptive statistics matter
In psychology, researchers often collect lots of raw data: the original scores before they have been summarised. For example, each participant might have a memory score, anxiety rating, reaction-time score, or questionnaire total.
A data set is a collection of scores. A score is one individual value in that data set.
Descriptive statistics
Descriptive statistics are numerical summaries of data. They describe what the collected scores look like, but they do not prove whether a finding is statistically significant.
Descriptive statistics help you answer questions like:
- What is the typical score?
- How spread out are the scores?
- What percentage of participants showed a behaviour?
- Do two variables seem related?
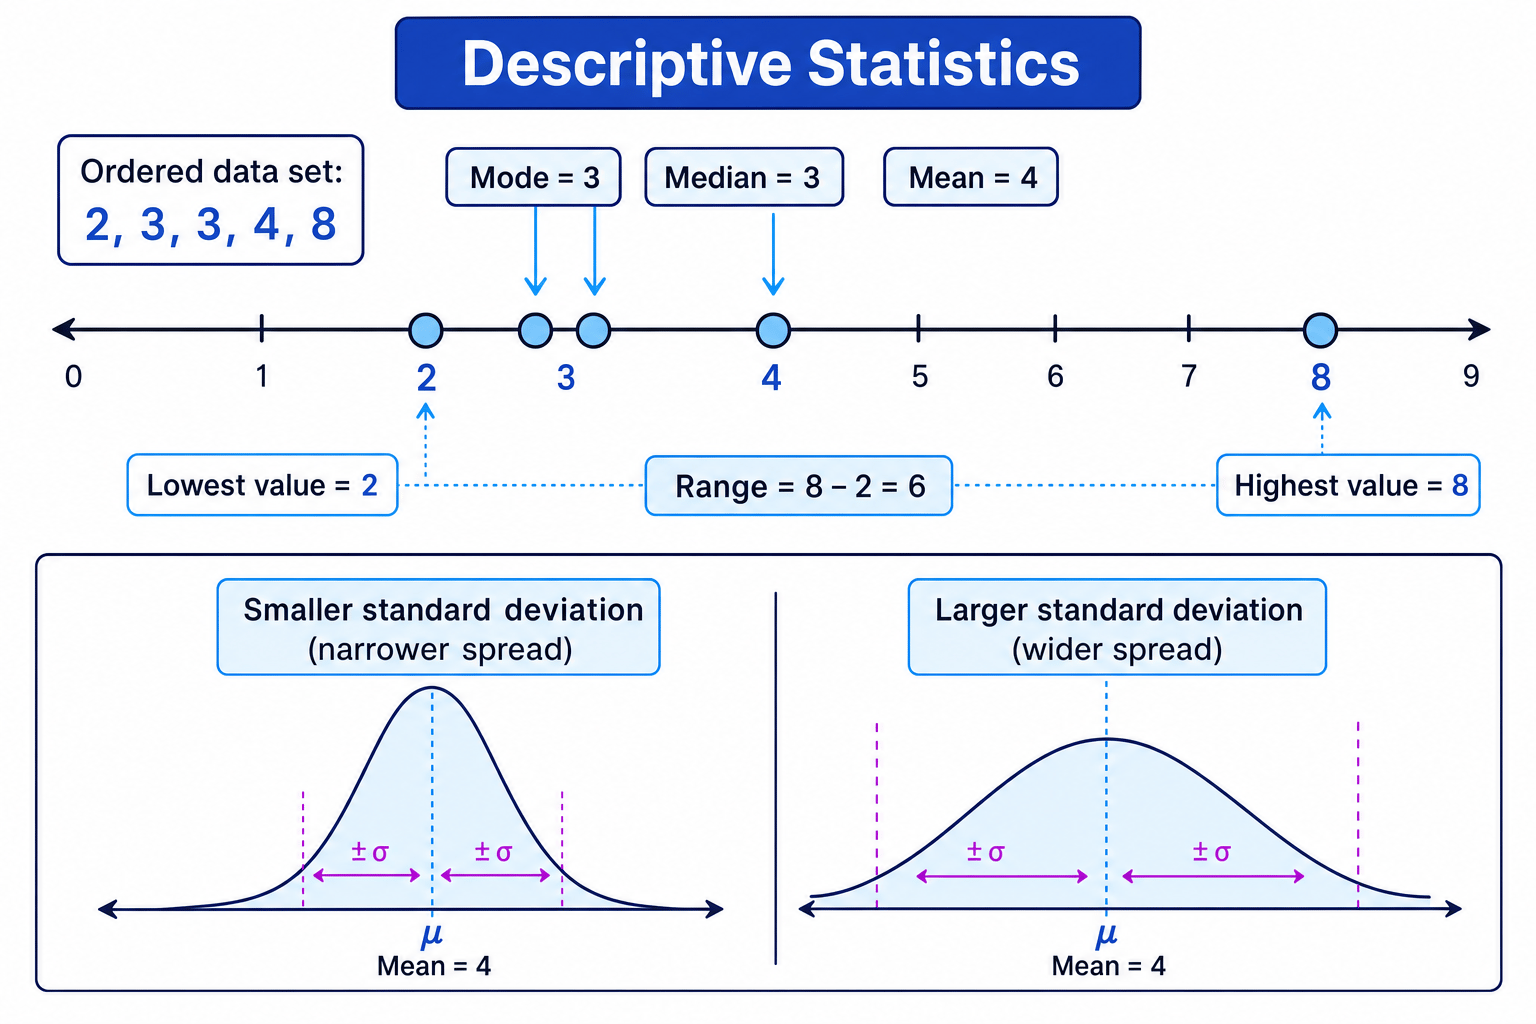
Measures of central tendency
Measure of central tendency
A measure of central tendency is a statistic that represents the typical, central, or average score in a data set.
There are three measures you need for AQA A-Level Psychology:
- Mean
- Median
- Mode
Each one gives a slightly different idea of what “typical” means.
The mean
The mean is the arithmetic average. You calculate it by adding all the scores and dividing by the number of scores.
mean=sum of all scoresnumber of scores\text{mean} = \frac{\text{sum of all scores}}{\text{number of scores}}mean=number of scoressum of all scoresThe mean uses every score, so it is often seen as the most sensitive measure of central tendency.
However, it can be distorted by an outlier, which is an unusually extreme score compared with the rest of the data.
The median
The median is the middle score when all scores are placed in numerical order.
If there is an odd number of scores, the median is the single middle value. If there is an even number of scores, the median is halfway between the two middle values.
The median is useful when a data set contains outliers because it is not pulled as strongly by extreme scores.
The mode
The mode is the most frequently occurring score or category.
The mode is especially useful for nominal data, which means data in categories, such as attachment type, diagnosis category, or preferred therapy option.
A data set can have:
- one mode
- more than one mode
- no mode if all scores occur equally often
Calculating mean, median and mode
A psychologist records six stress scores:
2, 3, 3, 4, 5, 13
-
Calculate the mean by adding all scores: 2+3+3+4+5+13=302 + 3 + 3 + 4 + 5 + 13 = 302+3+3+4+5+13=30.
-
Divide by the number of scores: 306=5\frac{30}{6} = 5630=5, so the mean is 5.
-
Find the median by locating the two middle scores, because there are six scores. The middle scores are 3 and 4.
-
Calculate the midpoint of the two middle scores: 3+42=3.5\frac{3 + 4}{2} = 3.523+4=3.5, so the median is 3.5.
-
Identify the most frequent score. The score 3 appears twice, more than any other score, so the mode is 3.
Choosing an average
The mean is usually best when scores are numerical and fairly balanced. The median is better when there are outliers. The mode is best when the data are categories.
Assuming the mean is always best
Do not automatically choose the mean. If one participant has an extreme score, the mean may give a misleading impression of the “typical” participant.
Measures of dispersion
Dispersion
Dispersion means how spread out the scores are in a data set.
Two groups can have the same mean but very different spreads. For example, one class might all score around 15 on a memory test, while another class has some very high scores and some very low scores. Their mean could be the same, but the second class is less consistent.
AQA expects you to know two measures of dispersion:
- range
- standard deviation
The range
The range is the difference between the highest score and the lowest score.
range=highest score−lowest score\text{range} = \text{highest score} - \text{lowest score}range=highest score−lowest scoreIt is quick and easy to calculate, but it only uses two scores, so it is heavily affected by outliers.
Calculating the range
A researcher records memory scores:
4, 6, 7, 8, 10, 18
-
Identify the highest score: 18.
-
Identify the lowest score: 4.
-
Subtract the lowest score from the highest score: 18−4=1418 - 4 = 1418−4=14, so the range is 14.
Counting the number of scores
The range is not how many scores there are. It is the distance from the lowest score to the highest score.
Standard deviation
The standard deviation is a measure of how far scores typically vary from the mean.
A small standard deviation means scores are clustered closely around the mean. A large standard deviation means scores are more spread out.
You are expected to understand what standard deviation shows, but for AQA Psychology this sub-topic only specifies calculation of the range, not calculation of standard deviation.
Interpreting standard deviation
Two conditions in a memory experiment both have a mean score of 12.
- Condition A has a standard deviation of 1.5.
- Condition B has a standard deviation of 5.8.
-
Compare the means first. Both conditions have the same mean, so their average performance is equal.
-
Compare the standard deviations. Condition A has the smaller standard deviation, so its scores are more tightly clustered around 12.
-
Interpret consistency. Condition B has the larger standard deviation, so participants’ scores varied more widely; the mean may be less representative of individual performance in that condition.
Sanity check for spread
A low standard deviation means “similar scores”. A high standard deviation means “varied scores”.
Calculating percentages
Percentage
A percentage expresses a value as a proportion out of 100.
Percentages are useful because they make data easier to compare, especially when groups are different sizes.
percentage=partwhole×100\text{percentage} = \frac{\text{part}}{\text{whole}} \times 100percentage=wholepart×100For example, “12 out of 20 participants obeyed” can be converted into a percentage so it is easier to understand and compare.
Calculating a percentage
In a study of conformity, 18 out of 30 participants give the same incorrect answer as the majority at least once.
-
Identify the part: 18 participants conformed at least once.
-
Identify the whole: there were 30 participants in total.
-
Substitute into the formula: 1830×100=60\frac{18}{30} \times 100 = 603018×100=60, so 60% of participants conformed at least once.
Ignoring sample size
Percentages can hide small numbers. If 50% of a group showed a behaviour, that could mean 1 out of 2 people or 50 out of 100 people.
Correlations
Correlation
A correlation is a relationship between two co-variables. A co-variable is a measured variable in a correlational study, such as hours of sleep and anxiety score.
In a correlation, the researcher does not manipulate an independent variable. They measure two variables and look for a relationship between them.
Correlations are often shown on a scattergraph, where each dot represents one participant’s pair of scores.
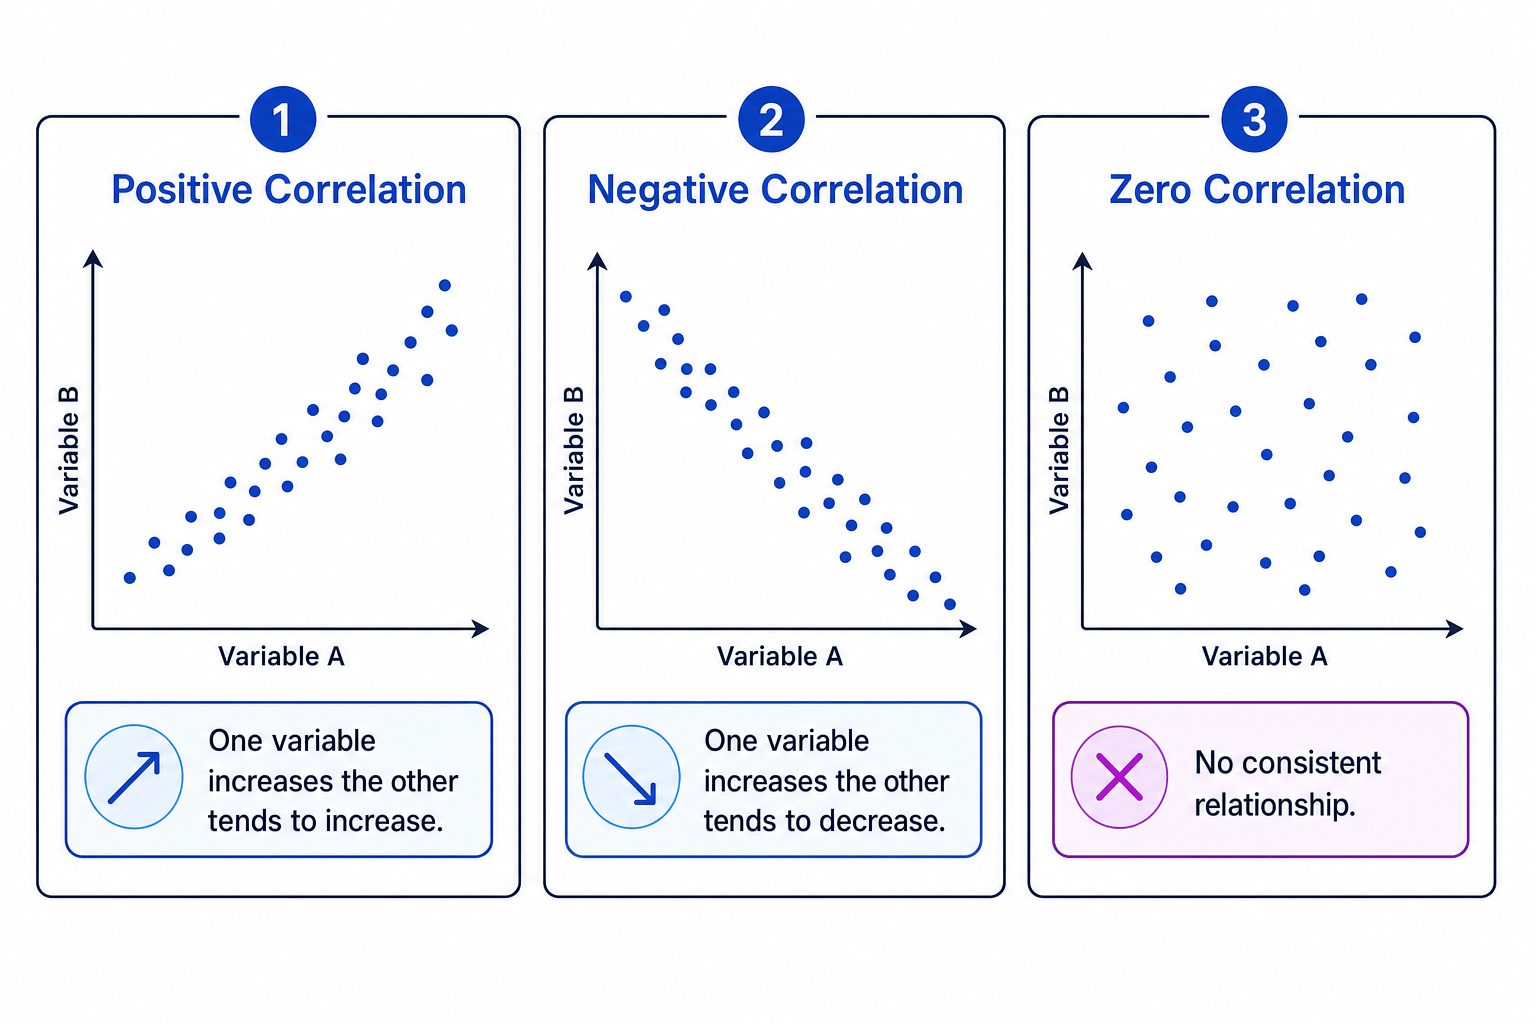
Positive correlation
A positive correlation means that as one co-variable increases, the other co-variable also tends to increase.
Example: as hours spent revising increase, test scores may also increase.
Negative correlation
A negative correlation means that as one co-variable increases, the other co-variable tends to decrease.
Example: as stress increases, sleep quality may decrease.
Zero correlation
A zero correlation means there is no consistent relationship between the two co-variables.
Example: shoe size and memory score would probably show no meaningful relationship.
A correlation may also be described using a correlation coefficient, usually written as rrr. The value of rrr ranges from −1-1−1 to +1+1+1:
- closer to +1+1+1 means a stronger positive correlation
- closer to −1-1−1 means a stronger negative correlation
- close to 0 means little or no correlation
Interpreting correlations
A psychologist finds these relationships:
- revision time and test score: r=+0.72r = +0.72r=+0.72
- anxiety score and sleep quality: r=−0.64r = -0.64r=−0.64
- height and memory score: r=+0.03r = +0.03r=+0.03
-
Use the sign of each coefficient. +0.72+0.72+0.72 is positive, −0.64-0.64−0.64 is negative, and +0.03+0.03+0.03 is very close to zero.
-
Interpret the positive relationship. Revision time and test score increase together, so students who revise more tend to score higher.
-
Interpret the negative relationship. As anxiety score increases, sleep quality tends to decrease.
-
Interpret the near-zero relationship. Height and memory score show almost no consistent relationship.
Correlation is not causation
A correlation does not prove that one variable caused the other. There may be a third variable involved, or the direction of the relationship may be unclear.
Bringing it together
For descriptive statistics, strong answers usually do three things:
- Calculate accurately using the correct rule.
- Label the statistic clearly, such as mean, median, mode or range.
- Interpret the result in context, using the scenario you are given.
If a question asks which statistic is most appropriate, explain why. For example, the median may be better than the mean when there is an extreme score, while the mode may be better for categorical data.
In the exam
-
Check whether the question asks you to calculate, identify, or justify a descriptive statistic.
-
For central tendency, decide whether the data are numerical, affected by outliers, or categorical before choosing mean, median or mode.
-
For correlations, describe the direction of the relationship, but avoid claiming that one co-variable caused the other.
Check yourself
- When would the median be more appropriate than the mean?
- How do you calculate the range from a set of scores?
- What is the difference between a negative correlation and a zero correlation?
