What you'll learn
- What a distribution is and how it is shown on a graph.
- The key characteristics of normal, positively skewed, and negatively skewed distributions.
- How the mean, median, and mode behave in different distribution shapes.
- Why distribution shape matters when interpreting psychological research findings.
From raw scores to a distribution
In psychology, researchers often collect lots of scores: memory test results, questionnaire scores, reaction-time scores, aggression ratings, anxiety scores, and so on. A single score tells you about one participant, but a distribution tells you about the whole set of scores.
Distribution
A distribution is the pattern formed by a set of scores, showing how often each score or range of scores occurs.
A distribution is usually shown on a graph:
- The x-axis shows the score or category of score.
- The y-axis shows the frequency, meaning how many times that score occurs.
Frequency
Frequency means the number of times a particular score, value, or category appears in a dataset.
For example, if five participants score 7 on a memory test, the frequency for score 7 is five.
Measures of central tendency
Before you can understand the shape of distributions, you need to be confident with the three main measures of central tendency.
Measures of central tendency
Measures of central tendency are ways of describing the “typical” or “average” score in a dataset. The three main ones are the mean, median, and mode.
- The mean is the arithmetic average: add all scores and divide by the number of scores.
- The median is the middle score when the data are placed in order.
- The mode is the most common score.
These averages help you describe where the centre of the distribution is — but they do not always behave in the same way.
Comparing mean, median and mode
Scores: 2, 3, 3, 4, 8
- Add the scores to find the total: 2 plus 3 plus 3 plus 4 plus 8 gives 20. There are five scores, so the mean is 20 divided by 5, which gives 4.
- Put the scores in order. They already are: 2, 3, 3, 4, 8. The middle score is 3, so the median is 3.
- Identify the most frequent score. The score 3 appears twice, more than any other score, so the mode is 3.
- Compare the averages. The mean is higher than the median and mode because the extreme score 8 pulls it upwards. This hints that the data may be positively skewed.
The three main distribution shapes
Psychology students need to recognise two broad types of distribution:
- Normal distributions, where scores are balanced and symmetrical.
- Skewed distributions, where scores are unevenly spread and pulled towards one end.
Normal distributions
Normal distribution
A normal distribution is a symmetrical, bell-shaped distribution where most scores cluster around the centre and fewer scores occur at the extremes.
A normal distribution has several key characteristics:
- It is symmetrical, meaning the left and right sides are mirror images.
- It is bell-shaped.
- It is usually unimodal, meaning it has one clear peak.
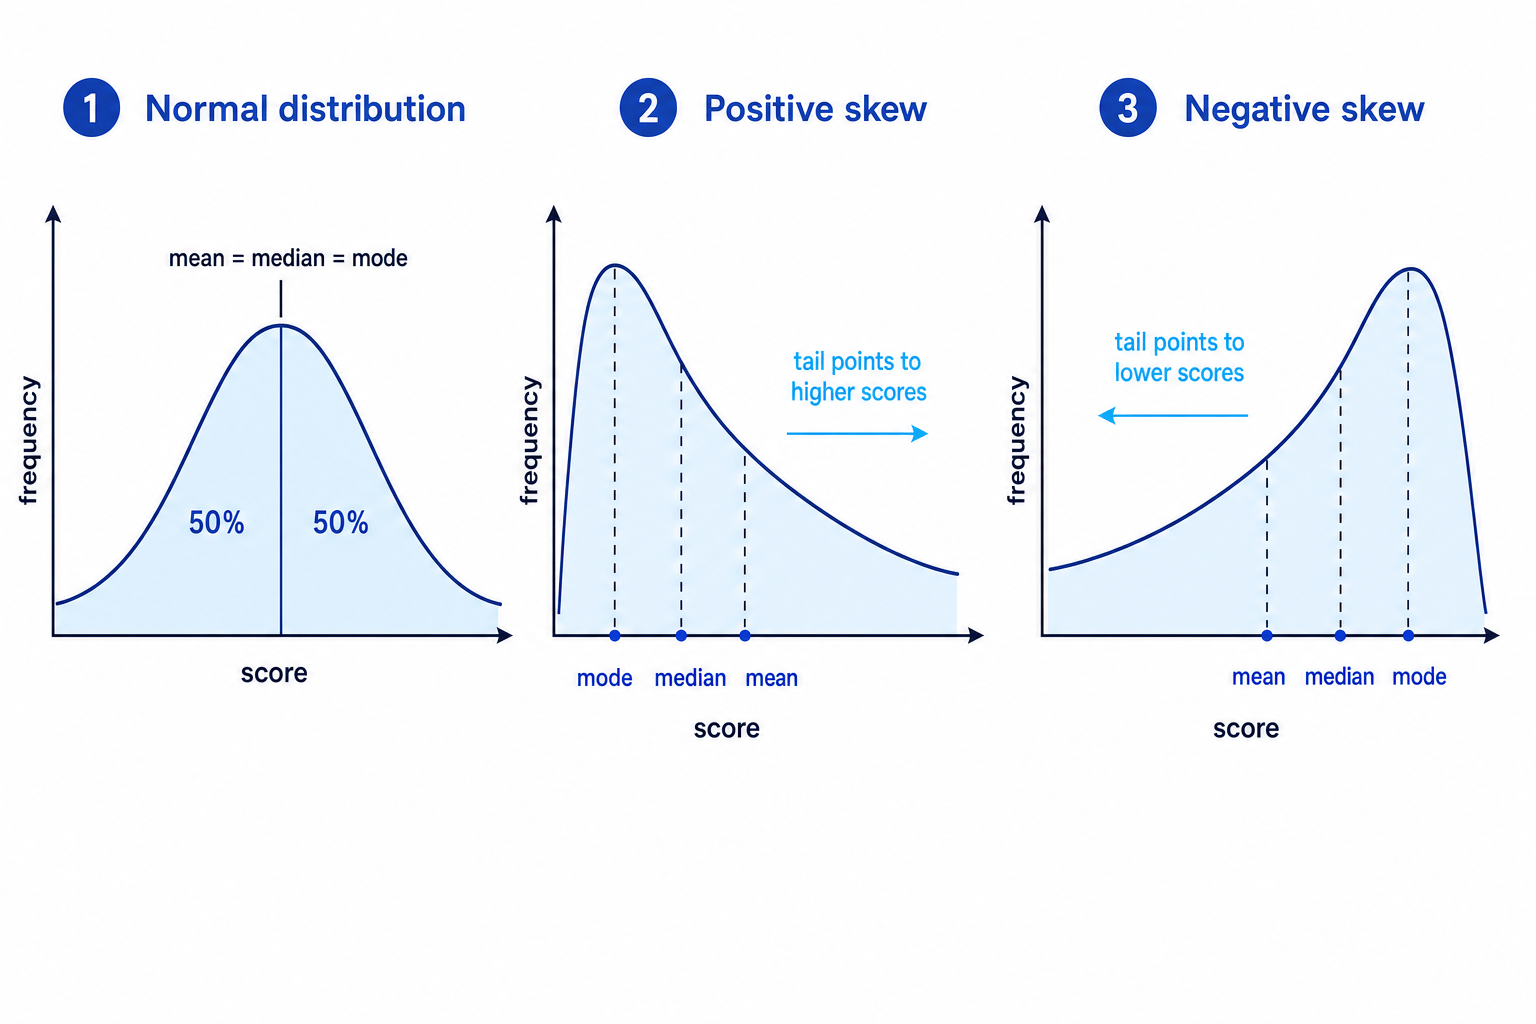
- The mean, median, and mode are all in the same central position.
- Half the scores lie above the centre and half lie below it.
- Extreme scores are possible, but they are less frequent.
Normal distributions are common in psychology because many human characteristics are spread around an average. For example, many cognitive abilities, personality traits, and biological measures are often treated as approximately normally distributed.
Normal distribution takeaway
In a normal distribution, most scores are near the middle, few scores are extreme, and the mean, median and mode are the same or very similar.
Recognising a roughly normal pattern
A researcher records memory test scores: 12, 13, 14, 15, 15, 16, 17, 18
- Check the spread of scores around the centre. The scores are balanced around 15: low scores such as 12, 13 and 14 are matched by higher scores such as 16, 17 and 18.
- Find the median. The two middle scores are 15 and 15, so the median is 15.
- Find the mean. The total is 120, and there are eight scores, so the mean is 15.
- Compare the averages and shape. The mean and median are the same, and the scores are balanced on both sides, so this dataset looks roughly normal.
Roughly normal is enough
Real psychological data are rarely perfectly normal. In exams, look for the overall pattern: symmetry, one central peak, and similar mean, median and mode.
Skewed distributions
Skewed distribution
A skewed distribution is an asymmetrical distribution where scores are not evenly balanced around the centre. One side has a longer tail, meaning a stretch of less frequent, more extreme scores.
The tail is the important part. Skew is named after the direction of the tail, not the side where most scores are piled up.
Positive skew
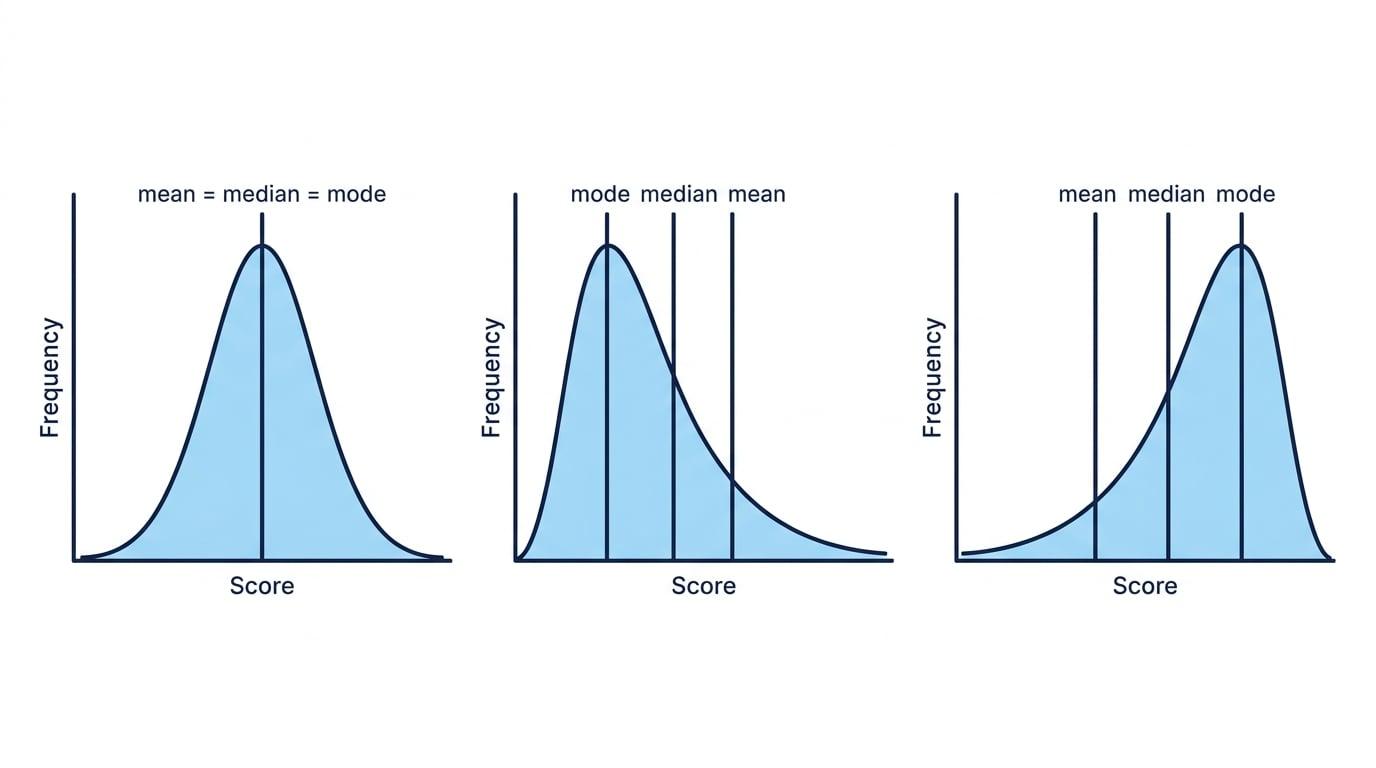
A positively skewed distribution has a long tail to the right, towards the higher scores.
Its main characteristics are:
- Most scores are clustered at the lower end.
- A small number of unusually high scores stretch the distribution to the right.
- The mean is pulled upwards by the high scores.
- The usual order from left to right is: mode, median, mean.
Positive skew can occur when a variable has a natural lower limit. For example, many people in a general population sample might score low on a depression questionnaire, but a few people score very highly. The high scores create a long right-hand tail.
Negative skew
A negatively skewed distribution has a long tail to the left, towards the lower scores.
Its main characteristics are:
- Most scores are clustered at the higher end.
- A small number of unusually low scores stretch the distribution to the left.
- The mean is pulled downwards by the low scores.
- The usual order from left to right is: mean, median, mode.
Negative skew can occur when a task is too easy. For example, if most participants score very highly on a simple memory task, only a few low scores will form a tail on the left.
Name the tail
A positive skew has a tail pointing to higher scores. A negative skew has a tail pointing to lower scores.
Identifying the type of skew
A class completes a very easy attention task. Most students score between 18 and 20, but a few score much lower. The mean is 16, the median is 18, and the mode is 20.
- Locate where most scores are clustered. Most scores are high, between 18 and 20, so the peak is towards the right-hand side.
- Identify the direction of the unusual scores. The few unusual scores are lower, so the tail stretches towards the left.
- Compare the averages. The mean is lower than the median and mode because the low scores pull it downwards.
- Decide the distribution shape. A tail to the left means the distribution is negatively skewed.
Naming the pile-up instead of the tail
Do not call a distribution “positive” just because most scores are high. A pile-up of high scores with a tail to the left is a negative skew.
Floor and ceiling effects
Skewed distributions can reveal problems with the way a psychological test or questionnaire has been designed.
Floor and ceiling effects
A floor effect happens when many scores cluster at the lowest possible point. A ceiling effect happens when many scores cluster at the highest possible point.
A floor effect may occur if a task is too hard, so most participants score near zero. A ceiling effect may occur if a task is too easy, so most participants score near the maximum.
These effects matter because they reduce the sensitivity of the measure. If almost everyone scores the same, it becomes difficult to detect real differences between people or conditions.
Spotting a ceiling effect
A researcher tests whether a new revision strategy improves memory. The memory test is out of 20, and most participants score 19 or 20 in both conditions.
- Look at whether the task can separate participants. Because most scores are at the top end, the test is not distinguishing between stronger and weaker performance.
- Identify the distribution problem. The scores are clustered near the maximum, so this suggests a ceiling effect.
- Explain the research consequence. The researcher may wrongly conclude that the revision strategy has little effect, when the real problem is that the test was too easy to show improvement.
Why distributions matter in psychology
Distribution shape is not just a graphing issue. It affects how psychologists describe, interpret, and analyse data.
Choosing the best average
For a normal distribution, the mean is usually a good summary because it sits in the centre and uses every score.
For a skewed distribution, the median may be more representative because the mean can be distorted by extreme scores. For example, in a positively skewed set of anxiety scores, a few very high scores can make the mean seem higher than what is typical for most participants.
Identifying outliers
An outlier is a score that is unusually far away from most other scores. Outliers can create or exaggerate skew.
Outliers are important because they may reflect:
- a genuine unusual participant response,
- a data-entry error,
- a participant misunderstanding the task,
- or a meaningful subgroup within the sample.
Researchers should not automatically remove outliers. They need a clear, justified reason.
Choosing statistical tests
Some inferential statistical tests are parametric tests, meaning they make assumptions about the data, including that the data are roughly normally distributed. Examples include Pearson’s r and related or unrelated t-tests.
Other tests are non-parametric tests, meaning they make fewer assumptions about distribution shape. Examples include Spearman’s rho, Mann-Whitney U, Wilcoxon signed-ranks, Chi-square, and the Sign test.
You do not need to run these tests in this topic, but you should understand why checking distribution shape is part of responsible data analysis.
Evaluating research quality
Distribution shape can support AO3 evaluation. If a researcher uses the mean for heavily skewed data, their conclusion may be less valid because the “average” may not represent most participants. Similarly, floor or ceiling effects can weaken a study because the measurement tool may not be sensitive enough.
Ethical data presentation
When distributions involve sensitive psychological variables, such as mental health scores or offender data, researchers should present data anonymously and avoid graphs that could identify individual participants in small samples.
In the exam
- When describing a distribution, mention shape, symmetry, tail direction, and the relationship between mean, median and mode.
- For skew, name the direction of the tail, not the side where most scores are clustered.
- Link distribution shape to interpretation: normal data make the mean more useful, while skewed data may make the median more appropriate.
Check yourself
- How would you describe the mean, median and mode in a normal distribution?
- A dataset has most scores at the low end and a long tail to the right. What type of skew is this?
- Why might a ceiling effect make it hard to detect a real difference between two conditions?