What you'll learn
- How secondary data differs from primary data, and how it can be quantitative or qualitative.
- How sociologists use existing research, official statistics and documents such as letters, diaries and newspaper reports.
- How to evaluate secondary sources using practical, ethical and theoretical issues.
- How to build AO1, AO2 and AO3 points for Eduqas Component 2 methods questions.
Starting point: what counts as secondary data?
In sociological research, data means the evidence sociologists collect, analyse and interpret. Data can be numbers, words, images, records, observations or documents.
Secondary data
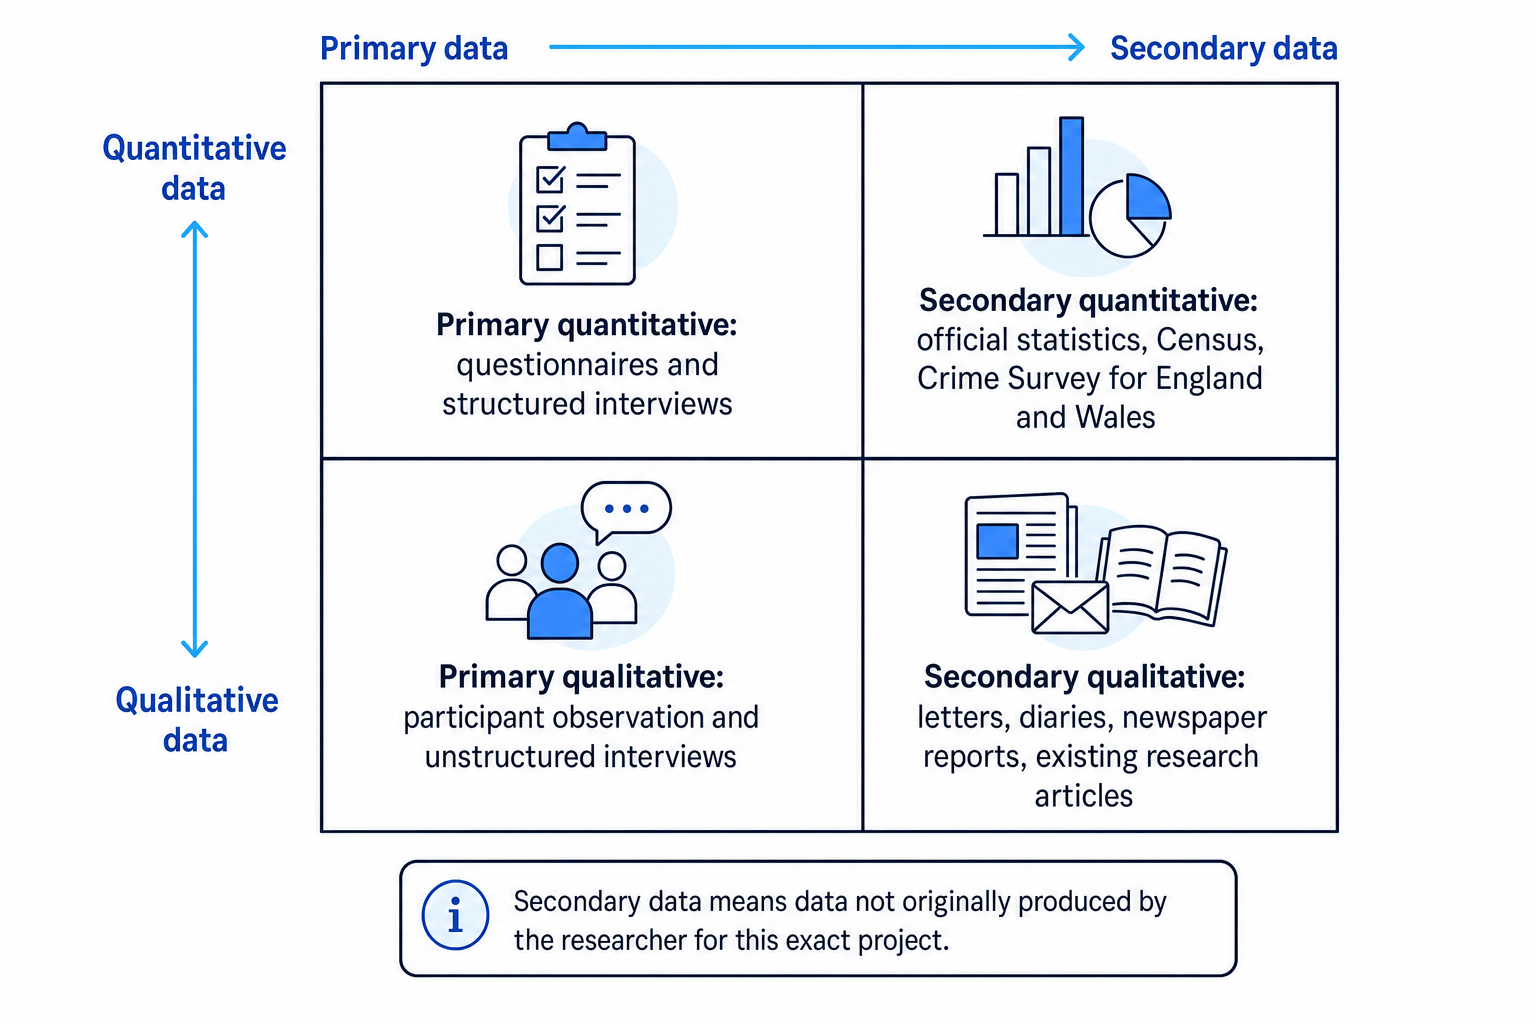
Secondary data is information that already exists before your research project begins. It was produced by someone else, or produced for a different purpose from your own research question.
This matters because a sociologist using secondary data is not directly creating the evidence. They are re-using, re-analysing or interpreting evidence that already exists.
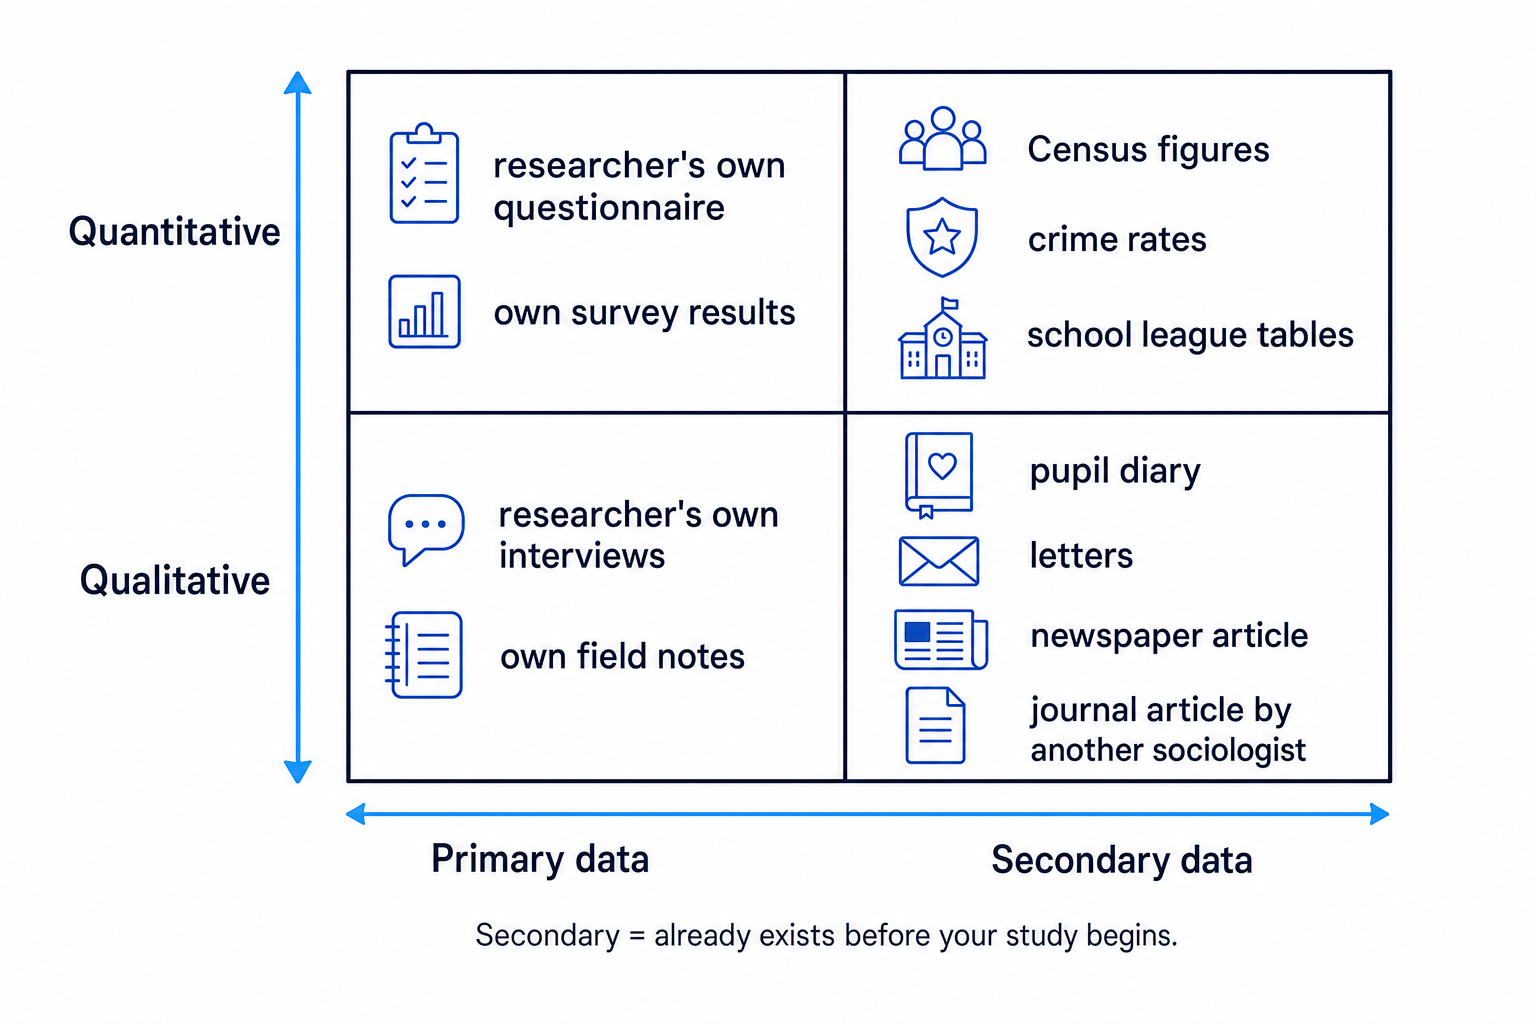
Secondary data can be quantitative or qualitative. Quantitative data is numerical data, such as Census figures or crime rates. Qualitative data is non-numerical data, such as diary entries, letters, newspaper articles or interview extracts from an earlier study.
The basic distinction
Primary data is created by the researcher for their own study. Secondary data already exists, so the researcher must ask: Who produced it, why, how, and with what possible bias?
Classifying data sources
A student is researching social class and educational achievement. They have four sources: school league tables, a diary written by a pupil, a questionnaire they designed themselves, and a journal article by another sociologist.
- Separate primary from secondary: the student’s own questionnaire is primary because they created it for this project. The other three already exist, so they are secondary.
- Separate quantitative from qualitative: school league tables are quantitative because they contain numerical results and rankings. The pupil’s diary is qualitative because it gives meanings, experiences and identity.
- Classify existing research carefully: the journal article is secondary for the student using it, even if the original sociologist collected primary interview or survey data.
- Apply this to method choice: the student could use the league tables for broad patterns, then the diary and journal article to explore explanations behind those patterns.
Why use secondary methods?
Secondary methods are attractive because they can save time and money. Instead of carrying out a national survey, a sociologist can analyse large datasets from organisations such as the Office for National Statistics, often shortened to ONS.
They can also allow researchers to study the past. You cannot interview a Victorian factory worker, but you may be able to analyse diaries, government reports, letters or newspaper coverage from the period.
Secondary methods can also reduce ethical problems because the researcher may not need to disturb participants directly. For example, analysing published Census tables does not require approaching thousands of households.
However, secondary data is rarely a perfect fit. It may have been collected using definitions, categories or priorities that do not match the sociologist’s research question.
Assuming secondary means worse
Secondary data is not automatically weaker than primary data. Some official datasets are huge, carefully collected and highly representative. The key issue is whether the data is fit for the sociologist’s purpose.
Existing sociological research
Existing sociological research means previous studies, journal articles, books, reports and datasets produced by sociologists or research organisations.
A researcher normally starts by reading existing research. This helps them avoid repeating work unnecessarily, identify gaps in knowledge and develop sharper concepts.
A literature review is a structured summary and evaluation of existing research on a topic. It is not just “what other people said”; it compares evidence, methods, theories and conclusions.
For example, a student researching youth cultures might read work by Cohen on moral panics, Willis on working-class boys and schooling, or Thornton on club cultures. This gives AO1 knowledge and helps the student design better primary research.
Strengths of using existing research
Existing studies can provide strong background knowledge. They may contain rich data, theoretical arguments and findings from groups that are difficult to access directly.
They are also useful for triangulation, which means checking a claim by comparing evidence from more than one method or source. If interviews, official statistics and previous studies all point in a similar direction, the argument may become more convincing.
Limitations of using existing research
Existing research may be outdated. A study of family life from the 1950s may not capture contemporary UK patterns such as increased cohabitation, same-sex marriage, blended families or digital communication.
It may also reflect the original researcher’s theoretical perspective. A Marxist study may emphasise class power and capitalism; a feminist study may emphasise patriarchy; an interactionist study may focus on meanings and labels. These perspectives are useful, but they shape what the researcher notices.
AO3 move
When evaluating existing research, do not just say “it is biased”. Explain how its sample, date, method or theoretical perspective may limit its usefulness for the new research question.
Official statistics
Official statistics
Official statistics are numerical data collected or published by government departments, public agencies or official bodies. Examples include Census data, school results, unemployment figures, police recorded crime and health statistics.
In the UK, important examples include the Census, the Crime Survey for England and Wales, police recorded crime, ONS labour market statistics, NHS data, school performance data, and deprivation indices such as the Welsh Index of Multiple Deprivation.
Official statistics are especially important for studying power and stratification. They can show patterns by social class, gender, ethnicity, age, region or disability. For example, deprivation indices can reveal how poverty is concentrated in particular areas, while Census data can show changing household structures and ethnic diversity.
They also connect to policy. Governments and local authorities use official data to allocate funding, plan services, monitor inequalities and evaluate whether policies are working.
Why positivists often like official statistics
Positivism is the view that sociology should aim to be scientific, objective and based on observable evidence. Positivists often value official statistics because they can be large-scale, standardised and comparable over time.
Durkheim’s study of suicide is the classic example. Durkheim used official suicide statistics to compare rates between social groups and argued that suicide was shaped by levels of social integration and regulation.
Why interpretivists and critical sociologists are cautious
Interpretivism is the view that sociology should focus on meanings, motives and lived experiences. Interpretivists argue that official statistics may miss the meanings behind behaviour.
Official statistics may also be socially constructed. This means they are not neutral facts simply “found” in society; they are shaped by definitions, recording practices and power.
Atkinson criticised the use of suicide statistics, arguing that official suicide rates depend partly on coroners’ decisions about whether a death counts as suicide. Similarly, crime statistics depend on whether victims report crime and whether police record it.
Evaluating crime statistics
A sociologist wants to know whether crime is increasing in England and Wales. They compare police recorded crime with the Crime Survey for England and Wales.
- Assess what each source measures: police recorded crime measures offences reported to and recorded by the police. The Crime Survey asks a sample of people about victimisation experiences, including some crimes not reported to police.
- Identify the validity problem: police figures may rise because recording practices improve or more victims report crime, not necessarily because more crime is happening.
- Identify the representativeness issue: the Crime Survey uses a sample, so it aims to represent the wider population, but it may exclude or undercount some experiences, such as crimes against businesses or people outside private households.
- Reach a balanced judgement: using both sources gives a stronger picture than relying on one, but neither source gives a complete measure of all crime.
Reading official statistics carefully
Official statistics often use categories. A nominal category is a label with no ranking, such as religious affiliation. An ordinal category has an order, such as deprivation quintiles from least to most deprived. A sampling frame is the list or source from which a sample is drawn.
Response rates matter too. If certain groups are less likely to respond, the data may become less representative. This is important when researching marginalised groups, where power and inequality may affect who is counted and who remains invisible.
Treating categories as natural
Categories such as “unemployed”, “ethnic group” or “household type” are useful, but they are also official definitions. They may not fully capture people’s identities, cultures or lived experiences.
Documents: letters, diaries and newspaper reports
Documents
Documents are written or recorded materials that sociologists analyse as evidence. They can include letters, diaries, autobiographies, newspapers, reports, websites, policy documents and organisational records.
Documents are often qualitative, though they can be turned into quantitative data through content analysis. Content analysis means systematically counting or coding themes, words, images or representations in documents.
For example, a sociologist could count how often newspaper articles describe young people as “dangerous”, “vulnerable” or “antisocial”. This links directly to socialisation, culture and identity because media representations can shape how groups are seen.
Another approach is discourse analysis, which studies how language constructs meanings and power. A discourse is a way of talking about something that makes some ideas seem normal and others seem deviant or impossible.
Personal documents
Personal documents include letters, diaries and autobiographies. Thomas and Znaniecki’s study The Polish Peasant in Europe and America used letters and life histories to understand migration and identity.
Personal documents can be high in validity because they may reveal emotions, values and meanings in the writer’s own words. Plummer called these kinds of materials “documents of life” because they can show how people understand their own biographies.
However, they are not pure truth. People may exaggerate, hide details, misremember events or present themselves in a particular way. Goffman’s idea of self-presentation is useful here: even personal accounts may involve managing impressions.
Newspaper reports
Newspaper reports are public documents. They are useful for studying media representations, moral panics and the construction of deviance.
Cohen’s study of Mods and Rockers showed how media reporting could exaggerate deviance and create “folk devils”. This is a strong example of secondary qualitative data being used to analyse power, labelling and social control.
Newspapers also raise questions about ownership and ideology. Marxist sociologists may argue that newspapers often reflect the interests of powerful groups. Feminists may examine how women are represented through gender stereotypes. Interactionists may focus on how labels are attached to groups.
Applying Scott’s criteria to a newspaper report
A sociologist finds a newspaper article about knife crime and wants to use it as secondary data. Scott’s criteria help judge its usefulness.
- Authenticity: check whether the article is genuine, correctly dated and from the newspaper it claims to be from.
- Credibility: assess whether the report is accurate or exaggerated, considering sources used, headline language and whether claims are supported.
- Representativeness: ask whether this article reflects wider media coverage or is an unusual case chosen because it is dramatic.
- Meaning: interpret the language carefully, such as whether young people are framed as threats, victims or products of social inequality.
- Overall judgement: the article may be useful for studying media representation, but it is weaker evidence for measuring the actual level of knife crime.
Comparing the main types of secondary data
| Type of secondary data | Best used for | Key strengths | Key limitations |
|---|---|---|---|
| Existing sociological research | Building theory, comparing findings, literature reviews | Saves time; gives concepts and evidence; supports triangulation | May be outdated, selective or shaped by original theory |
| Official statistics | Measuring patterns, trends and inequalities | Large scale; often representative; useful for policy | Definitions may change; may lack validity; can reflect state priorities |
| Personal documents | Understanding meanings, identity and lived experience | Rich qualitative detail; access to the past | May be unrepresentative, incomplete or self-presented |
| Newspaper reports | Studying representation, discourse and moral panics | Easy access; shows public narratives | May exaggerate, stereotype or reflect ownership bias |
Best overall evaluation
The strongest answers avoid saying “secondary data is good” or “secondary data is bad”. Instead, judge the source in relation to the research aim, the group studied and the kind of claim being made.
Linking to practical, ethical and theoretical issues
Practically, secondary data can be cheap, quick and accessible. But access is not always simple. Some datasets are restricted, some archives are incomplete, and some documents may be difficult to interpret without context.
Ethically, using published data may reduce direct harm, but private documents create issues of consent and confidentiality. A diary may be deeply personal even if it has survived in an archive.
Theoretically, secondary data creates a debate between reliability and validity. Official statistics may be reliable because they use standardised categories, but they may lack validity if those categories do not capture real meanings. Personal documents may be valid and detailed, but less reliable because they are hard to replicate.
In the exam
- Define the source precisely: say whether you are discussing existing research, official statistics or documents, and whether the data is quantitative or qualitative.
- Apply to a real example: use examples such as the Census, Crime Survey for England and Wales, ONS deprivation data, diaries, letters or newspaper reports.
- Evaluate with the methods toolkit: cover practical issues, ethical issues and theoretical issues such as reliability, validity, representativeness, positivism and interpretivism.
- Make a balanced judgement: explain what the source is useful for and what it cannot prove on its own.
Check yourself
- Why might official statistics be reliable but not always valid?
- How could a sociologist use newspaper reports to study moral panics?
- What questions should you ask before using someone else’s research as secondary data?