What you'll learn
- What sociologists mean by demographic change and why it matters for families and households.
- The key UK trends in marriage, divorce, cohabitation, fertility, life expectancy and singlehood.
- How different perspectives — New Right, feminist, functionalist and postmodern — interpret these changes.
- How to evaluate demographic evidence using official statistics and apply it in essays.
Starting point: what is demography?
Demography is the study of populations: their size, structure and patterns of change. In Families and households, you use demography to explain why family forms have changed over time.
For this topic, you are mainly looking at changes in:
- how people form relationships;
- whether and when they have children;
- how long people live;
- whether people live with partners, relatives or alone.
Demographic change
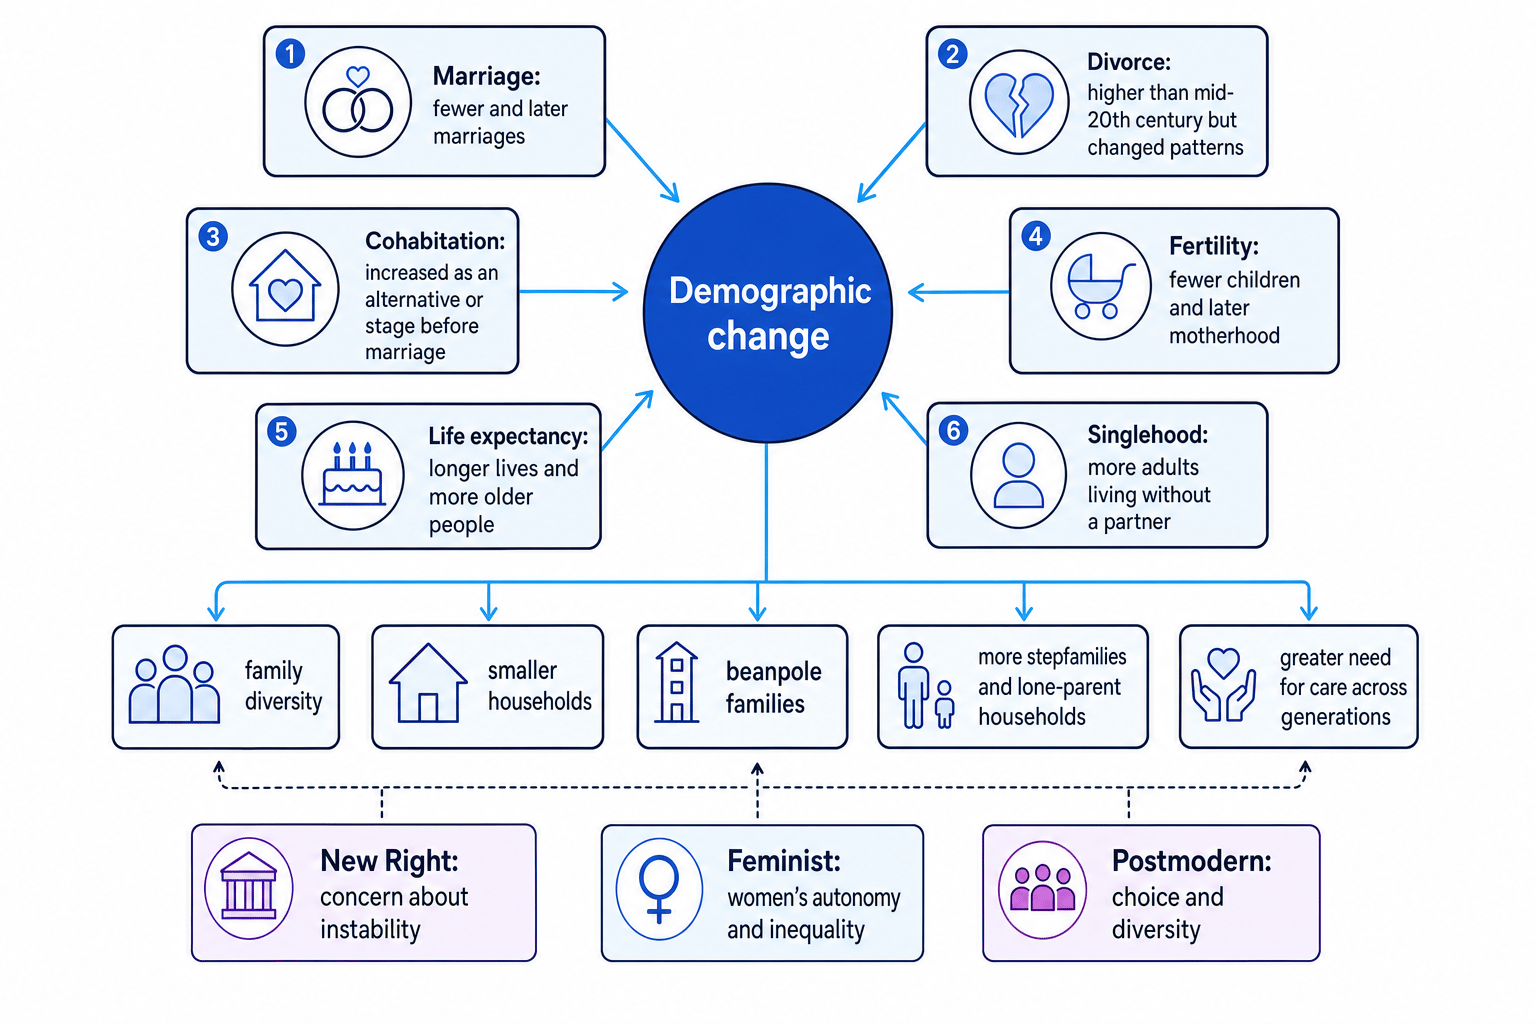
Demographic change means a shift in population patterns over time, such as changes in marriage, divorce, cohabitation, fertility, life expectancy and singlehood.
Demography is not just “numbers”. Sociologists ask why the numbers change and who benefits or loses from those changes. That brings in the cross-cutting themes of culture and identity — changing norms about love, gender and adulthood — and power and stratification — differences by class, gender, ethnicity, age and region.
The diagram below shows how the main trends connect to family diversity.
Marriage: fewer and later marriages
Marriage is a legally recognised relationship between partners. In the UK, long-term trends show fewer people marrying than in the mid-twentieth century, and those who do marry tend to marry later.
Reasons include:
- secularisation: religion has less influence over many people’s private lives;
- changing gender roles: women’s education and paid work make marriage less economically necessary;
- greater acceptance of cohabitation and remaining single;
- the cost of weddings, housing and raising children;
- individualisation, where people place more emphasis on personal choice and self-development.
Giddens argues that modern relationships are increasingly based on the pure relationship: a relationship continued only while both partners feel emotionally satisfied. Beck and Beck-Gernsheim link this to the “normal chaos of love”, where people still desire intimacy but have more choice and uncertainty.
Marriage has changed, not disappeared
Marriage is less automatic than it once was, but it still has cultural and legal significance. Many people cohabit first, marry later, or remarry after divorce.
AO2 examples include the legal recognition of same-sex marriage through the Marriage (Same Sex Couples) Act 2013, and civil partnerships through the Civil Partnership Act 2004. These changes show that marriage has become more inclusive, even while overall marriage rates have declined.
Sociological interpretations of marriage change
Functionalists such as Parsons saw the nuclear family as important for socialising children and stabilising adult personalities. From this view, marriage supports social order.
The New Right argue that declining marriage weakens family stability, especially for children. They often prefer the married, heterosexual nuclear family.
Feminists challenge this by arguing that traditional marriage often involved unequal domestic labour, economic dependence and male power. For some women, not marrying or leaving marriage can represent increased autonomy.
Postmodernists see the decline of automatic marriage as evidence of greater family diversity and personal choice.
Treating marriage decline as simple family decline
A fall in marriage rates does not automatically mean people care less about relationships. It may mean they form relationships differently, such as through cohabitation, civil partnerships, remarriage or long-term singlehood.
Divorce: legal and cultural change
Divorce is the legal ending of a marriage. Divorce became more common after legal reforms made it easier and less shameful to end a marriage.
Important policy changes include:
- the Divorce Reform Act 1969, which allowed divorce on the basis of irretrievable breakdown;
- the Divorce, Dissolution and Separation Act 2020, implemented in 2022, which introduced no-fault divorce in England and Wales.
Reasons for rising divorce across the late twentieth century include:
- reduced stigma around relationship breakdown;
- women’s greater financial independence;
- higher expectations of love, intimacy and equality;
- secularisation;
- legal aid and legal reforms;
- more awareness of domestic abuse and coercive control.
Fletcher argued that rising divorce may reflect higher expectations of marriage, not simply moral decline. People may leave marriages because they expect emotional satisfaction and equality.
Interpreting a change in divorce statistics
-
If a source shows divorce numbers falling in a recent period, connect this to the wider context: fewer people are marrying, and many couples cohabit instead, so there may be fewer marriages available to end in divorce.
-
Link the trend to family structure: divorce can still contribute to lone-parent families, stepfamilies and reconstituted families, even if annual divorce numbers fluctuate.
-
Evaluate the statistic by considering legal change. A reform such as no-fault divorce can temporarily affect recorded divorce figures, so the statistic may reflect administrative changes as well as relationship behaviour.
Divorce is often used in essays because it links clearly to family diversity. A divorced parent may form a lone-parent family, then later a reconstituted family or stepfamily if they repartner.
Reconstituted family
A reconstituted family is a family formed when one or both adults bring children from a previous relationship into a new family unit.
Evaluating divorce debates
The New Right tend to see divorce as evidence of family breakdown. Feminists reply that this can blame women for leaving unequal or harmful relationships. From a feminist view, access to divorce may protect women and children from patriarchal power.
Postmodernists focus on choice and diversity, but this can underplay inequality. A wealthy professional may find divorce easier than someone with insecure housing, low income or limited childcare support.
Cohabitation: living together without marriage
Cohabitation means living together as a couple without being married or in a civil partnership. It has increased significantly in the UK.
Some couples cohabit as a “trial marriage”. Others see it as a long-term alternative to marriage. Some raise children while cohabiting.
Reasons include:
- less religious pressure to marry;
- more liberal attitudes to sex and relationships;
- high wedding and housing costs;
- fear of divorce after seeing parental separation;
- the view that emotional commitment matters more than legal status.
Cohabitation
Cohabitation is when two people live together in an intimate relationship without being legally married or in a civil partnership.
A key AO2 point is that many people wrongly believe in “common-law marriage”. In England and Wales, cohabiting couples do not automatically have the same legal rights as married couples, especially around inheritance, pensions and property.
Chester’s idea of the neo-conventional family is useful here. He argued that although family life has become more diverse, many people still spend part of their lives in a two-parent, couple-based family. Cohabitation may be a stage before marriage rather than a complete rejection of it.
Fertility: fewer children and later parenthood
Fertility refers to patterns of childbearing in a population. In the UK, families generally have fewer children than in the post-war baby boom, and parenthood often happens later.
Reasons include:
- reliable contraception and access to abortion;
- women’s increased education and career opportunities;
- high costs of childcare and housing;
- changing gender identities and expectations;
- delayed marriage and cohabitation;
- uncertainty about work, income and the future.
Fertility
Fertility means the pattern of births in a population, including how many children people have and when they have them.
Lower fertility affects family life in several ways. Households may be smaller. Children may receive more parental attention and financial investment. There may be fewer siblings, cousins, aunts and uncles.
Explaining later parenthood and smaller families
-
Connect later parenthood to social change: women’s education, employment, contraception and housing costs can all delay when people feel ready to have children.
-
Infer the family consequence: if people start having children later, they may have fewer children overall, which contributes to smaller households and fewer siblings.
-
Add evaluation: postmodernists may see this as choice, but feminists and class analysts would stress that “choice” is shaped by unequal pay, childcare costs, insecure work and housing inequality.
There are also cultural differences in fertility patterns by ethnicity, religion and migration history, but these differences often change across generations. Be careful not to stereotype. Sociologists explain fertility through social conditions, not fixed “cultural traits”.
Life expectancy: longer lives and ageing families
Life expectancy is the average number of years a person is expected to live, based on current death rates. In the UK, life expectancy rose significantly across the twentieth century due to better healthcare, sanitation, nutrition, housing and working conditions.
Longer life expectancy contributes to an ageing population, meaning a larger proportion of older people. This changes families because more people have living grandparents and great-grandparents.
Beanpole family
A beanpole family is a long, thin family structure with several living generations but fewer members within each generation, such as fewer siblings, cousins, aunts and uncles.
The beanpole family is linked to both longer life expectancy and lower fertility. Families become more “vertical” across generations and less “horizontal” across siblings and cousins.
This can create more intergenerational support. Grandparents may provide childcare, emotional support and financial help. However, it can also create pressure on the “sandwich generation”: adults caring for both children and elderly parents.
Inequality in ageing
Life expectancy is not equal for everyone. Healthy life expectancy varies by social class, region, gender and ethnicity. People in deprived areas may live fewer years in good health. This links demographic change to power and stratification: ageing is not experienced in the same way by all groups.
Use ageing as both support and strain
In essays, avoid saying older people are only a “burden”. They may need care, but they also provide childcare, volunteering, emotional support and family continuity.
Singlehood: living without a partner
Singlehood refers to being an adult without a current co-residential partner. This includes people who are never married, separated, divorced or widowed. It does not necessarily mean loneliness or isolation.
More people live alone or spend longer periods single because of:
- later marriage and later cohabitation;
- divorce and separation;
- widowhood among older people;
- education and career mobility;
- individualisation and changing expectations of independence;
- housing patterns, although affordability can limit the ability to live alone.
Singlehood
Singlehood means living without a current partner, either temporarily or long term. It can include never-married, divorced, separated and widowed people.
Sociologists such as Morgan remind us to look at family practices: what people do to create family life. A single person may still be deeply involved in family networks, friendships, chosen families and care relationships.
Postmodernists interpret singlehood as evidence of lifestyle choice and diversity. However, this view needs evaluation. Some singlehood is chosen; some is shaped by bereavement, poverty, insecure housing, disability or caring responsibilities.
Using official statistics carefully
Much demographic evidence comes from official statistics, especially the Office for National Statistics (ONS) and the Census. These are useful because they cover large populations and allow trends over time.
However, you should evaluate them methodologically:
- Reliability: official statistics are collected in a standardised way, so they are useful for comparing trends.
- Representativeness: large-scale data can represent national patterns well.
- Validity: statistics may not reveal meanings, emotions or hidden experiences behind family life.
- Definitions: categories such as “household”, “family”, “single” or “cohabiting” may not capture complex relationships.
- Policy effects: legal changes can change recorded behaviour, such as divorce figures, without proving that attitudes changed overnight.
Statistics need sociology
Official statistics show patterns, but sociological theory explains why those patterns happen and what they mean for people’s lives.
Big picture: what do demographic changes show?
Demographic changes show that UK family life has become more diverse, but not completely random or equal.
A strong essay can argue that:
- functionalists and the New Right worry about stability and socialisation;
- feminists highlight women’s autonomy but also continuing inequality;
- postmodernists emphasise choice, diversity and fluid identities;
- class, gender, ethnicity, age and region shape how much “choice” people really have.
So the best answer is balanced: demographic changes reflect greater freedom for many people, but they are also shaped by social structures such as law, the economy, patriarchy, housing and welfare policy.
In the exam
-
Start with the specific demographic trend named in the question, then link it directly to family or household change.
-
Use at least one contemporary UK example, such as ONS data, cohabitation, no-fault divorce, same-sex marriage, ageing or rising solo living.
-
Evaluate by comparing perspectives: for example, New Right concern about instability versus feminist or postmodern arguments about autonomy and diversity.
Check yourself
- How could falling marriage rates and rising cohabitation both show changing attitudes to commitment?
- Why might longer life expectancy create both support and pressure within families?
- What is one strength and one limitation of using official statistics to study family change?